A Histogram uses bars to display the distribution of individual points in a data set in an easy-to-read format. Comparing this distribution to set specification limits can help users understand the current process capabilities.
Available only from an open Histogram chart, the GainSeeker Charts Overpack Wizard is a useful tool for helping to determine if overpack levels in your processes could safely be reduced. A shift in process or reduction in variation could minimize the overpack in your process, saving a substantial amount of money over time. See Using the Overpack Wizard
|
Contents [Hide] |
A standard normal distribution should approximate the shape of a bell curve in most instances.

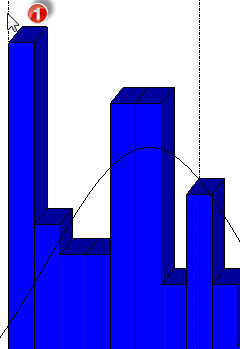
Fig. 1 Click anywhere on a bar to display its value.
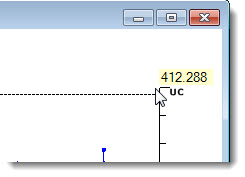
Fig. 2 Click on the top of any limit line to display the value limit.
Fig. 1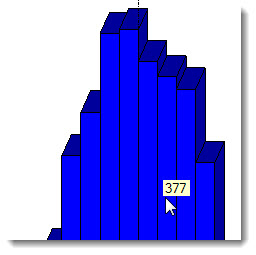 Fig. 2
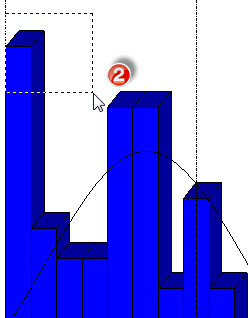
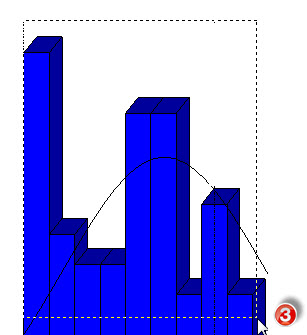
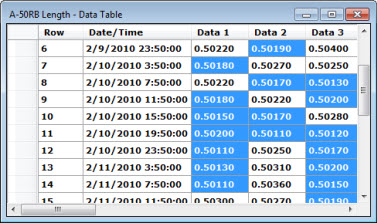
You can select data points on one or more bars and display a Data Table highlighting that data.
