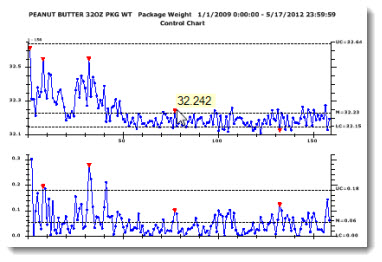
A Chart dashboard control serves as a quick reference for data retrievals on the dashboard window. Unlike a charting window not associated with a dashboard, it has limited drill-down capabilities. The Chart control can be used in conjunction with other controls on the host dashboard window.
Clicking data points on the Chart control displays tool tips, and a right-click menu for the control offers an option for viewing detailed data on a Data Table window.
This control can automatically refresh at a time interval you define or it can refresh along with the dashboard window.
|
Contents [Hide] |
Following, is an example of how a Chart dashboard control might look on a running dashboard, depending on the chart and data types and properties you assign to it. This example also shows a data point tool tip.

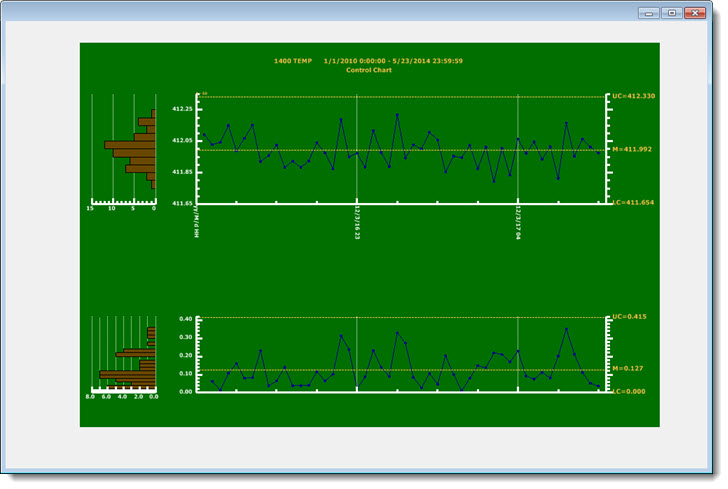
Following is an example of a chart skin applied to a chart dashboard control. See Editing the Chart Skin Property.
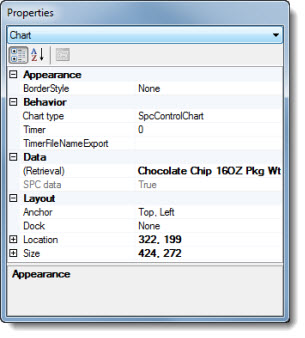
Most of the Chart control properties (attributes) may be familiar in usage and do not usually require additional explanation.
For more information, see Using the Properties dialog
Click the Chart button on the dashboard controls toolbar on a dashboard window that is open in design/edit mode.

The Dashboard Control Retrieval dialog opens. See Using the Dashboard Control Retrieval dialog
Then, click OK or NEXT after a retrieval is selected on the Dashboard Control Retrieval dialog.
The Chart control opens on the host dashboard window in design/edit mode. The selected data retrieval will display after the dashboard window is saved in design/edit mode and reopened in run mode. For information on moving the chart on the dashboard window see Changing the Chart location on a dashboard window
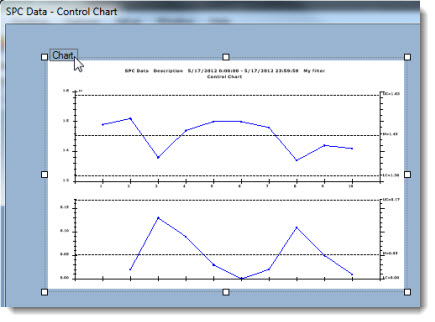
There are two methods for selecting the Chart control for edit:
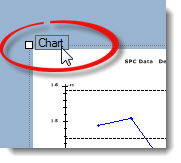
Click the Chart tab on the upper-left corner of the control on a dashboard window that is open in design/edit mode, or
Click Chart in the drop-down list on the Properties dialog on a dashboard window that is open in design/edit mode.
The Properties dialog menu changes to display the Chart setting and the properties grid displays the properties specific to this control.
The Chart control first opens as a Control Chart by default for SPC data, and a Pareto Chart for DMS data. The Chart type for a SPC or DMS data retrieval can be easily changed.
To change the chart type:

The Select Chart Type dialog opens displaying a SPC or a DMS list of available charts, depending on which data type was selected on the Dashboard Control Retrieval dialog. This example of the dialog displays SPC chart types:
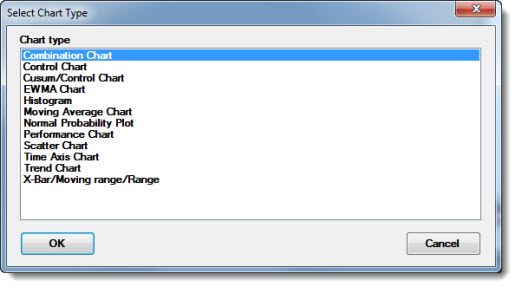
The control displays the new chart type in design/edit mode. The control will display actual data after the host dashboard is saved in design/edit mode and opened in run mode.
To change the (Retrieval) property setting in the Properties dialog.
Click the ellipsis button in the value cell.
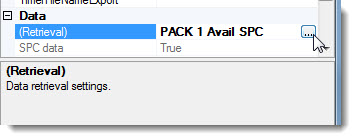
The Dashboard Control Retrieval dialog opens. See Using the Dashboard Control Retrieval dialog
For information on editing some of the other Chart properties, see:
There are two ways to change the location of the control on the dashboard:
Click and hold the control tab (circled in red for this example) while dragging (moving) the control to a new location on the dashboard window.

