![]() The DateTime dashboard control can be set to:
The DateTime dashboard control can be set to:
display the current date and time.
display the date and time of the most recent dashboard refresh.
display the date and time of the latest data collection (checks for new data based on clock time) and launch an action if the next check is overdue.
display the date and time of the latest data collection (checks for new data based on elapsed time since the last check) and launch an action if the next check is overdue.
The DateTime dashboard control can be set to refresh along with the dashboard. See Refreshing a dashboard
This an example of how a DateTime dashboard control might look on a dashboard in run mode, depending on the settings. This example is set to display the date and time of the most recent dashboard refresh. (See the "Last Refresh" option)
![]()
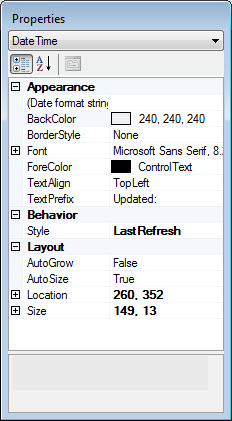
Some of the DateTime control properties (attributes) may be familiar in usage and may not usually require additional explanation. Some of the properties specifically designed for GainSeeker users are featured in this topic.
See Using the Properties dialog
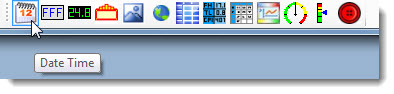
Click the DateTime button on the dashboard controls toolbar on a dashboard window that is open in design/edit mode
The DateTime Display Options dialog opens. See Using the DateTime Display Options dialog.
Click the DateTime dashboard control on the dashboard window that is open in design/edit mode to select the control for edit.
The Properties dialog menu changes to display the DateTime setting and the properties grid displays the properties specific to this control.
Use the Style property to edit the date and time display type.
To edit the Style property:
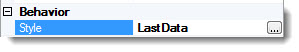
The DateTime Display Options dialog opens. See Using the DateTime Display Options dialog.
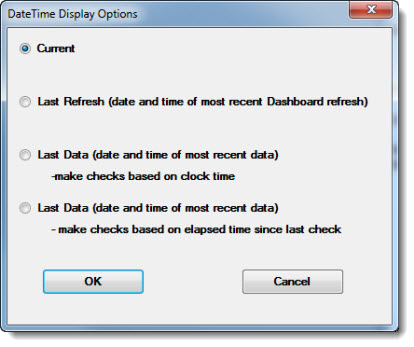
The DateTime display options include:
To set the control to display the current time and date:
Click the option button ![]() preceding the Current option on the DateTime Display Options dialog.
preceding the Current option on the DateTime Display Options dialog.
The control opens on the dashboard window in design/edit mode.
To set the control to display the Last Refresh (date and time of most recent dashboard refresh):
Click the option button ![]() preceding the Last Refresh option on the DateTime Display Options dialog.
preceding the Last Refresh option on the DateTime Display Options dialog.
Click OK on the DateTime Display Options dialog.
The control opens on the dashboard window in design/edit mode.
Also see, Refreshing a dashboard. To add a text label to the display, see Editing the TextPrefix property
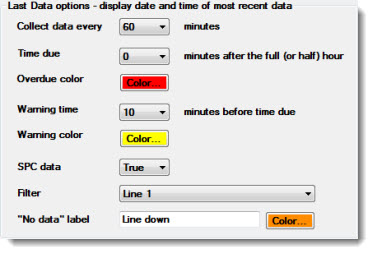
To display the date and time of the most recent scheduled data collection (based on clock time):
The DateTime Display Options dialog displays data options.
Displaying exception colors on the control
Collect data every ______minutes drop-down list:
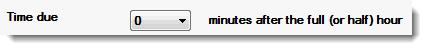
Time due ____minutes after the full (or half) hour drop-down list:
![]()
Click the Color... button to open the Color dialog. Then, click a color for the control to display to signify that data collection is overdue.
Warning time drop-down list
Warning color button
SPC data and Filter drop-down lists
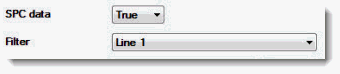
Click True on the SPC data drop-down list if the data collection is based on SPC data. Click False if it is based on DMS data.
Click a filter in the Filter drop-down list to select it. The Filter drop-down list will display SPC or DMS filters, depending on which is selected for data collection. Use the filter option to analyze only the data that meets the criteria of the selected filter, such as a specific shift, production line, or process step.
"No data" label text field and Color... button
![]()
Click the "No data" label text field to select the text. Then, enter a text label for the control to display when no updated data is available for a period of four hours after the next scheduled reading. When this label displays, it replaces any other date and time display text until data collection resumes.
Click the Color... button to open the Color dialog. Then, click a color for the control to display to signify that no data has been available for the previous four hours.
Click OK on the DataTime Display Options dialog.
The control opens on the dashboard window in design/edit mode.
To add a text label to the display, see Editing the TextPrefix property
To set this option for the control:
The DateTime Display Options dialog displays data options.
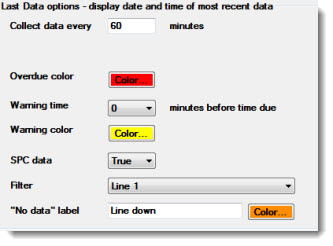
Collect data every ______minutes text field:
![]()
Click the text field to select the numeric value. Then, enter a new numeric value to represent the time interval between data collections.
Overdue Color button
Warning time drop-down list
Warning Color button
SPC data and Filter drop-down lists
Click True on the SPC data drop-down list if the data collection is based on SPC data. Click False if the data collection is based on DMS data.
Click a filter in the Filter drop-down list to select it. The Filter drop-down list will display SPC or DMS filters, depending on which is selected for the data collection. Use the filter option to analyze only the data that meets the criteria of the selected filter, such as a specific shift, production line, or process step.
"No data" label text field and Color... button
![]()
Click the "No data" label text field to select the text. Then, enter a text label for the control to display when no updated data is available.
Click the Color... button to open the Color dialog. Then, click a color for the control to display to signify a warning that no new updated data is available. When this label displays, it replaces any other date and time display text until data collection resumes.
The control opens on the dashboard window in design/edit mode.
The OverdueAction property configures an action to be automatically triggered each time this DateTime control changes to the Overdue color (or if the DateTime control already displays the Overdue color when the dashboard is opened). It is only triggered if the Style property is LastData or LastElapsed.
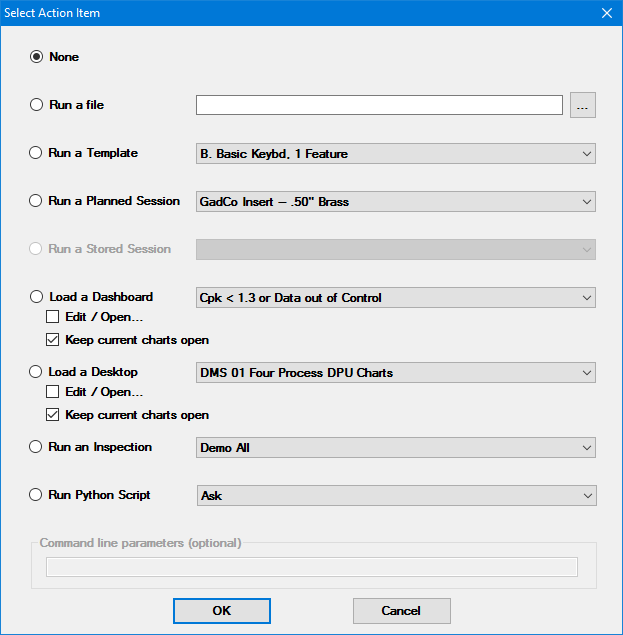
For dashboards and desktops:
The Edit/Open check box for lets you open a dashboard with changes or open a desktop with changes.
If both the Edit/Open and Keep Current Charts Open check boxes are selected for a dashboard, all chart windows are closed before the Edit Dashboard Settings window is displayed for the specified dashboard.
If both the Edit/Open and Keep Current Charts Open check boxes are selected for a desktop, the Edit Desktop Settings window is displayed for the specified desktop. After the user specifies any changes and clicks OK, all chart windows are closed and the desktop is opened with any specified changes.
You can optionally use command line parameters with the Run a File, Run a Template, Run a Planned Session, Run a Stored Session, Run an Inspection and Run Python Script options on the Select Action Item dialog. For more information, see Setting up shortcuts to perform automatic functions.
The TextPrefix property is used to enter a text label to precede the date and time display on the control.
To edit the TextPrefix property:
Click the TextPrefix property value cell in the Appearance category
Select the current text label in the cell.
![]()
Some of the date format string syntax used in GainSeeker version 8.2 and later and Dynamic Reports has changed from those used in earlier versions.
For more information about these changes, see Date/Time formats and Numeric Formats