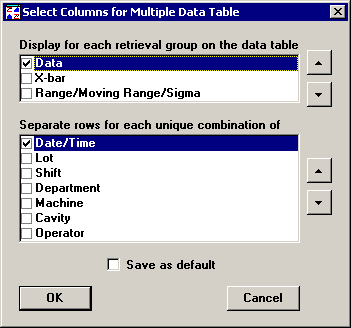
Each retrieval group can display columns for individual data values, the subgroup average (X-bar), and the subgroup range. If the standard for a retrieval group is configured to display a moving range or sigma instead of a subgroup range, this information is automatically substituted for the subgroup range on a Multiple Data Table.

By default, only the individual data value columns are displayed for each retrieval group – as shown in the table above. However, you configure SPC to display any combination of individual data values, subgroup average (X-bar), and subgroup range by following the steps below:
Generate a Multiple Data Table.
Click the Options menu, and then click Select Display Columns.
In the Display for each retrieval group on the data table list, select the check box for each type of data you want to display for each retrieval group.
You must select at least one of the three options in this list.

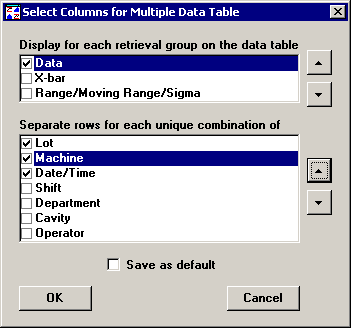
The Multiple Data Table will display the columns you select in the order shown on this screen. You can modify the order in which these columns are displayed.
To move an item up the list, click the row containing the item and then click the up ![]() button.
button.
To move an item down the list, click the row containing the item and then click the down ![]() button.
button.

If you want to save your selections as new default settings on this workstation, select the Save as default check box.
After selecting the fields and the order in which to display them, click OK.
More:
Sort order of rows in a Multiple Data Table
Right-click menu and Options menu for a Multiple Data Table
User configuration setting for Multiple Data Table columns