
The OEE (Overall Equipment Effectiveness) percentage is calculated using percentages from three metrics of which it is comprised: Availability, Performance, and Quality. OEE numbers are percentages that can be used to distill a wide variety of factors such as production line and shift, which allows for quick assessment of a plant's utilization. Higher OEE values indicate better efficiency.
The OEE percentage of this calculation indicates how a process is operating. This is based on the percentages from each its submetrics: Availability, Performance, and Quality.
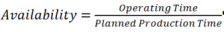
The Availability percentage of this calculation indicates the percentage of time the machine (or other asset) is performing its intended task.
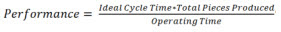
The Performance percentage indicates how fast the process is operating in relation to the maximum speed for which it was designed.
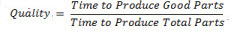
The Quality percentage takes the time lost in producing bad parts into account.
The following statistics are used to calculate (overall) OEE, Availability, Performance, and Quality.
OEE Sum (Good * Cycle Time) is the sum of the good parts produced multiplied by the ideal cycle time.
OEE Sum (Total * Cycle Time) is the sum indicates the total number of parts produced multiplied by the ideal cycle time.
OEE Sum Scheduled Time indicates the amount of time that the process was scheduled to be operational during a specified time period.

OEE Sum Available Time indicates the amount of time that the process was operational within a specified time period.
The OEE Sum Downtime indicates the amount of scheduled production time that was not utilized—the downtime.