The OEE metric is calculated from the percentages of three submetrics: Availability, Performance, and Quality.
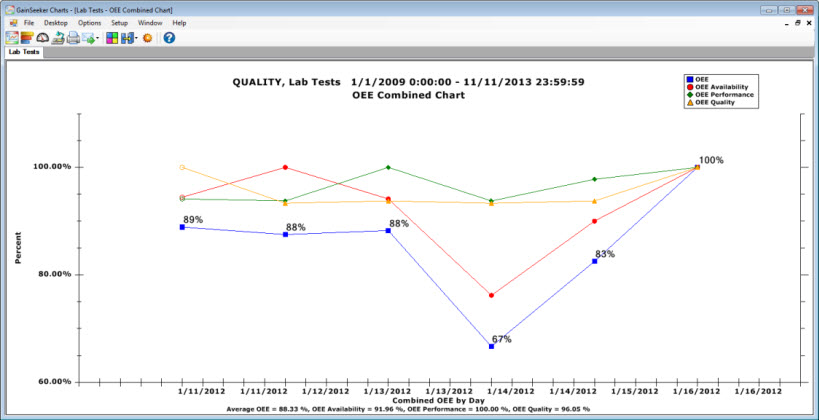
Example of an OEE Combined chart that displays the overall OEE metric and its submetrics:
Availability = 75.1%
Performance = 87.8%
Quality = 89.8%
OEE = Availability (75.1%) x Performance (87.8%) x Quality (89.8%)
OEE = 59.2%
To see how each of these metrics was calculated for this example, see:
It can be misleading to compare OEE numbers between manufacturers, or from plant to plant within the same company because no two plants, products, equipment, or human assets are identical. A good use for OEE numbers then is to establish baseline percentages for your organization and work to improve them—without comprising first-pass yield.
Following are OEE percentages that are typically considered to be good.
Availability 90%
Performance 95%
Quality 99.9% (may be low for some Six Sigma initiatives)
Overall OEE 85%+ for World Class Manufacturing (60% is average).
Examples of OEE Charts