window.dataLayer = window.dataLayer || []; function gtag(){dataLayer.push(arguments);} gtag('js', new Date()); gtag('config', 'G-X31CSP7LDB'); gtag('config', 'AW-1071191387');
Avatar for Phillip Mason

About Phillip Mason

This author has not yet filled in any details.
So far Phillip Mason has created 332 blog entries.

GainSeeker® OPC solution boosts OEE from 65% to 75% (Full version)

“In a data driven society, automated data collection is a must,” says John Foley, Network Administrator for Engineering Systems, of Pollak-APD (Actuator Products Division) a Stoneridge, Inc company. “The quicker we get information in hand, the better-off we are.” With this idea in mind, Hertzler Systems recently added some major new functionality to GainSeeker® SPC: support for OPC (Object Linking and Embedding for Process Control).

By |2023-09-27T09:57:11-04:00April 2, 2013|Case Studies, Defense, Industrial Equipment, Industry|Comments Off on GainSeeker® OPC solution boosts OEE from 65% to 75% (Full version)

Down-time Analysis Reduces Waste

Over a six-month period, GainSeeker helped a department of a transmission components supplier reduce the number of work days by two that it needed to keep up with production demands each week. Meanwhile, output increased by 25% as defects and scrap were minimized.

By |2023-09-27T09:56:14-04:00April 2, 2013|Case Studies, Automotive, Industry|Comments Off on Down-time Analysis Reduces Waste

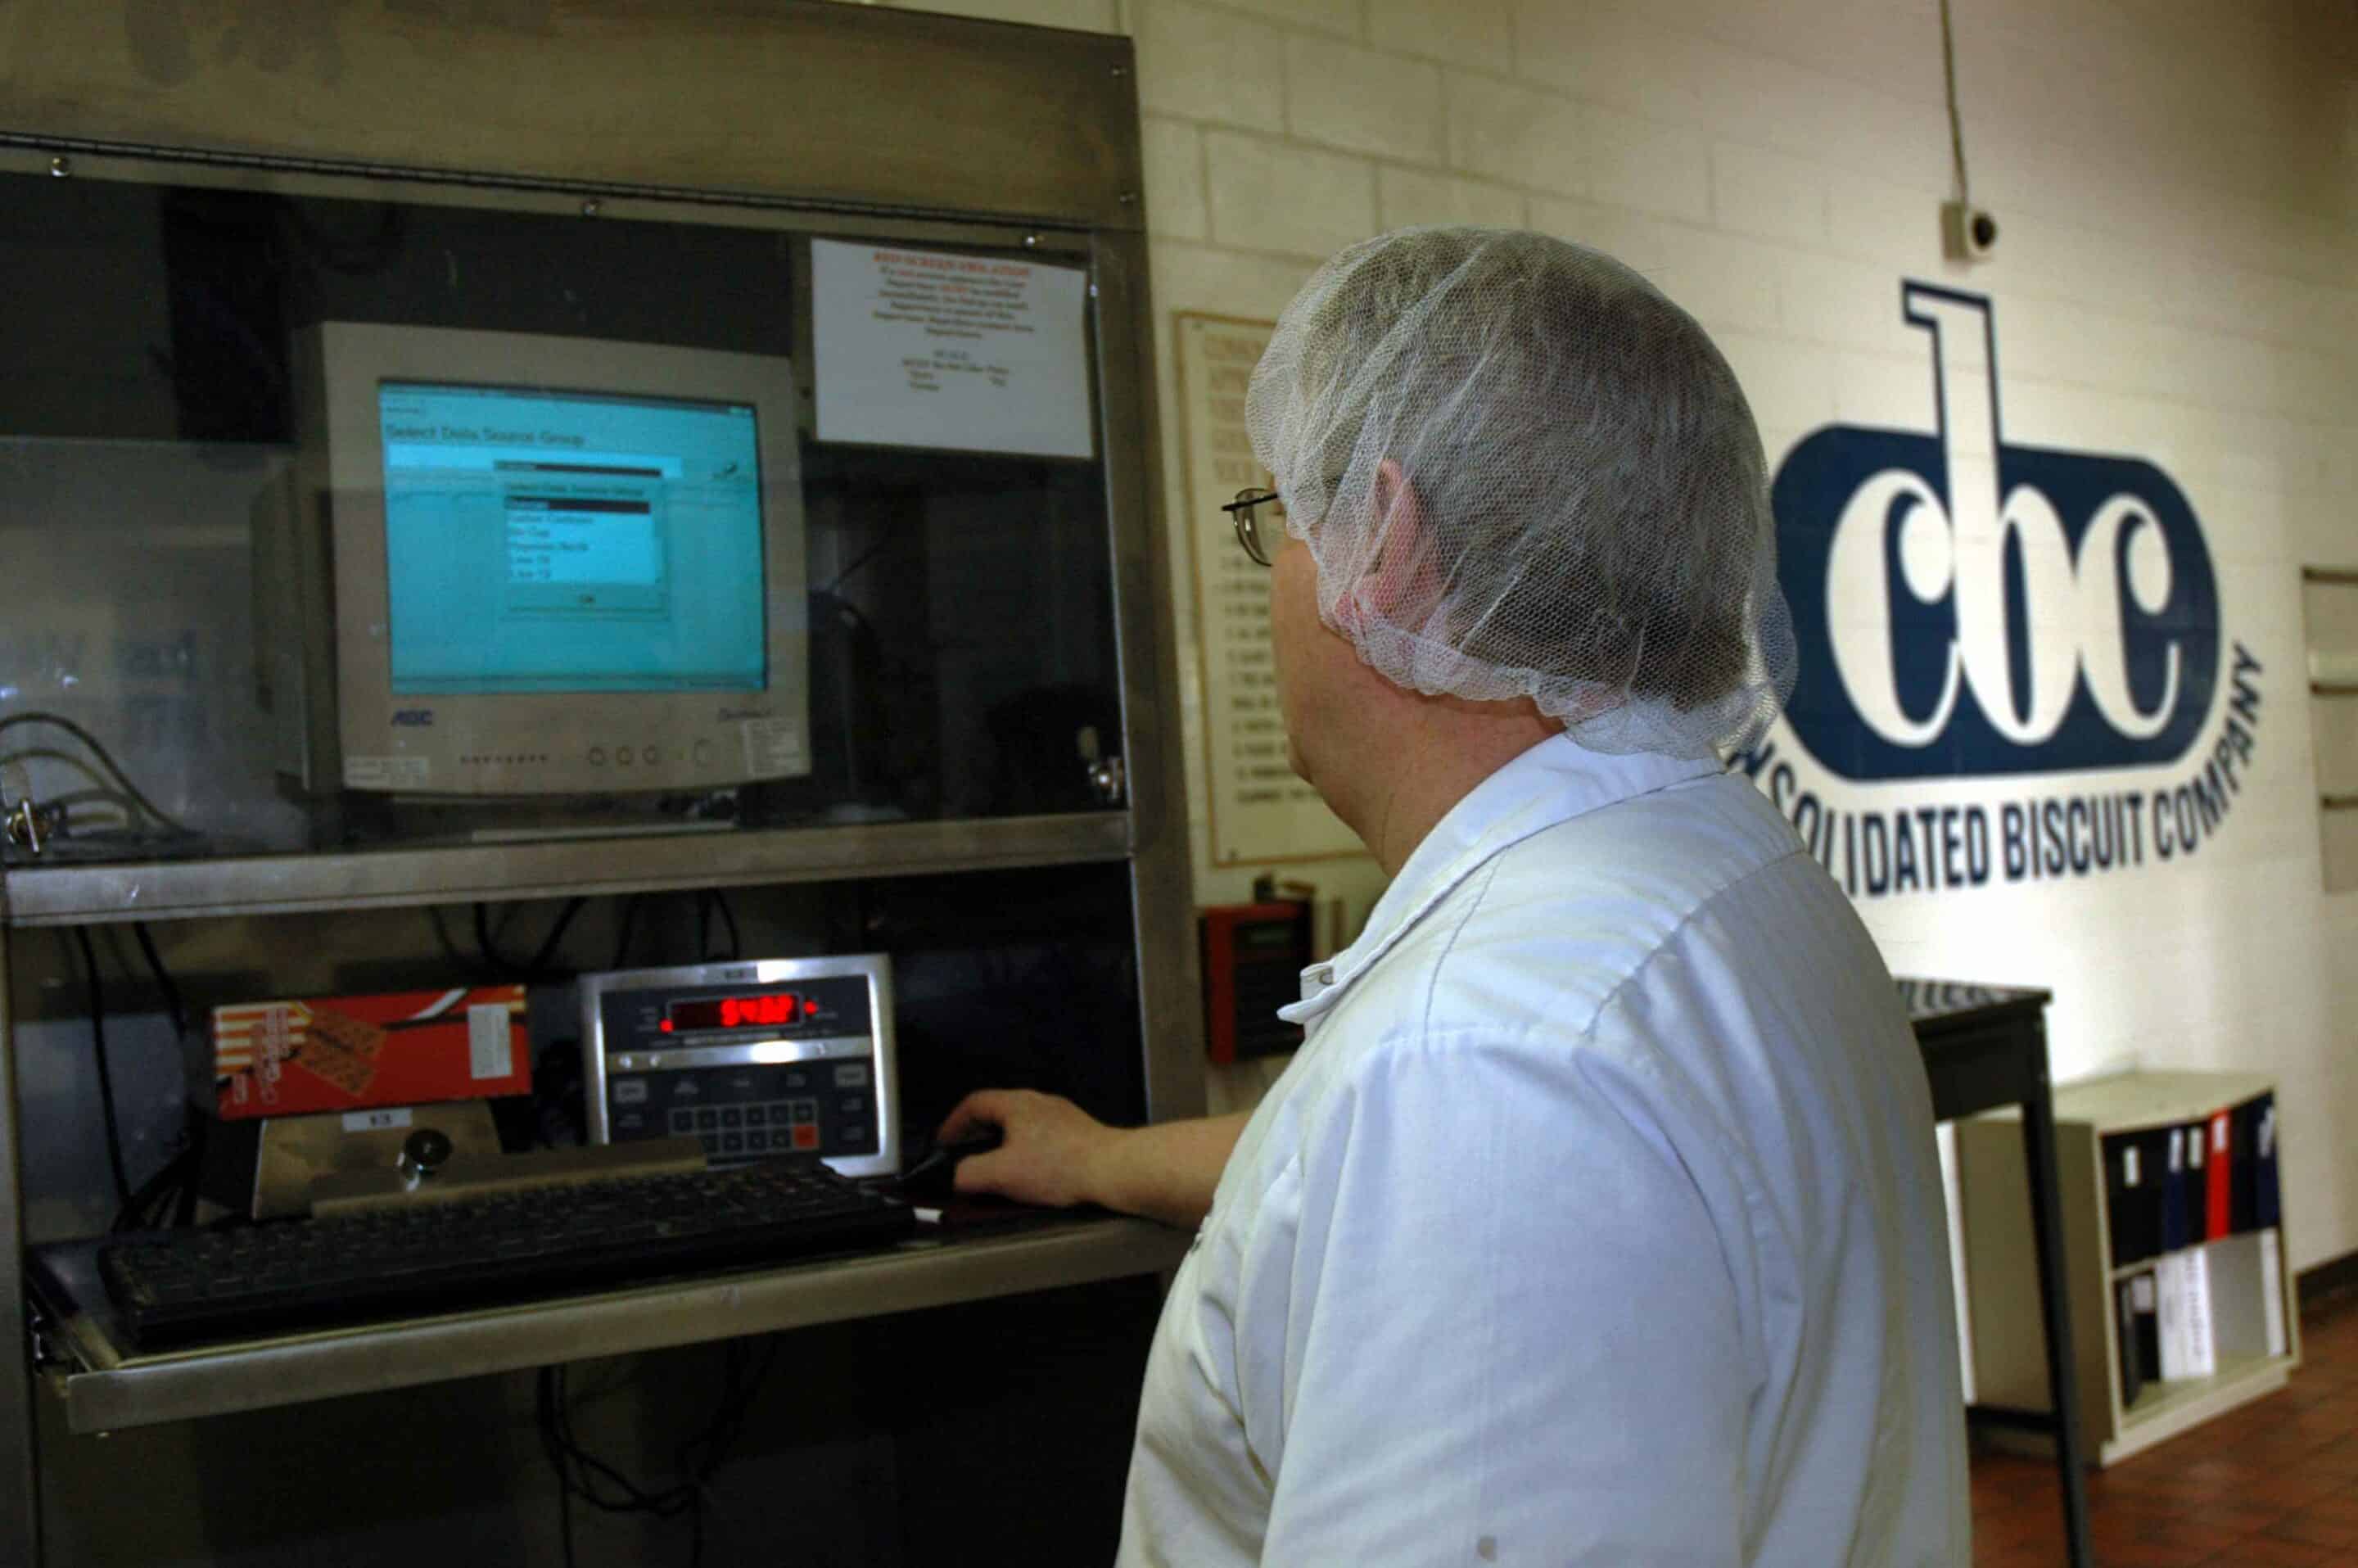
Controlling Net Contents and Reducing Give-Away

Consolidated Biscuit Company (CBC) has used Control Charts for years, but the culture of process control is now permeating the company like the smell of cookies baking. The cost savings attributed to not giving away unnecessary amounts of product is substantial.

By |2024-02-20T08:48:24-05:00April 2, 2013|Case Studies, Foods, Industry|Comments Off on Controlling Net Contents and Reducing Give-Away

McCormick Flavor Division reduces overpack and material costs by 10-30%

"Of all the plants in the McCormick Flavor Division, our plant is consistently at the top of the list for efficiency of material usage, and by a substantial margin. We trace that directly back to our use of the Hertzler [GainSeeker] software," John Campbell, quality manager, McCormick Flavor Division of McCormick & Company, Inc.

By |2024-02-20T09:15:32-05:00April 2, 2013|Case Studies, Foods, Industry|Comments Off on McCormick Flavor Division reduces overpack and material costs by 10-30%

Building a Six Sigma Measurement System in Financial Services

This case study looks at one company’s experience deploying and implementing a set of Six Sigma projects within the context of a robust data systems infrastructure – the establishment of which is a fundamental first step in developing an effective transactional Six Sigma initiative. With such an infrastructure in place, projects can proceed more rapidly and with greater success.

By |2024-02-19T07:21:40-05:00April 2, 2013|Case Studies, Etc., Industry|Comments Off on Building a Six Sigma Measurement System in Financial Services

Social media and quality…

I ran across a thought-provoking post at Modern Servant Leader about how social media has shifted job responsibilities in the corporate world.... What does it mean to shift quality assurance from "par" to "peak?" Has the advent of social media shifted the focus of your quality system from "acceptable quality levels" to "peak performance?"

By |2024-02-20T09:11:25-05:00March 20, 2013|Thought Leadership|Comments Off on Social media and quality…

Send to PowerPoint…

In GainSeeker Version 8.2, "Send to PowerPoint" loads PowerPoint and pastes whatever you're sending into a new slide. In prior releases you could get there, but you had to send the chart to the clipboard, and then flip to PowerPoint and paste it into a slide. . . .

By |2024-02-20T09:11:21-05:00January 22, 2013|Easy SPC, Easy to Use, GainSeeker Suite|Comments Off on Send to PowerPoint…

Normal Probability Plot…

The Normal Probability Plot chart gives you an easy-to-view answer to the question: "Can we meet our target?" You can get to this information by displaying specifications on the chart, and then looking at where the diagonal line crosses those specifications.

By |2024-02-20T09:11:18-05:00January 10, 2013|Easy SPC, Easy to Use, GainSeeker Suite|Comments Off on Normal Probability Plot…
Go to Top