GainSeeker Suite is the SPC Software solution for real-time, automated Statistical Process Control. We call it GainSeeker because it can help you maximize value and minimize costs. With GainSeeker you “Seek Gains” by uncovering opportunities to increase profitability, first pass yield, and throughput while you reduce variation, scrap, rework and other costly waste.
The first goal of any real-time SPC Software system is to give instantaneous feedback to process owners so they can know instantly when a problem arises. GainSeeker Suite does this as well or better than any other system on the market. It goes far beyond this basic functionality and delivers a number of unique, powerful, and easy-to-use data visualization and data analysis features that make it the premier system for automated Statistical Process Control.
Summary of unique data acquisition capabilities
On the data entry / acquisition side of the equation, GainSeeker provides these unique capabilities:
- Data entry forms that are easy to navigate
- Interfacing to any device or system
- Automated real-time charts, analysis, and alarms with feedback to people or equipment
- Automatically calculate derived features
- Integration with other business systems
- Customizable work flow control
- Document delivery solutions
Some competitive solutions offer parts of these capabilities. Only GainSeeker provides them all.
Summary of GainSeeker’s analysis and reporting capabilities
But GainSeeker doesn’t stop there. GainSeeker’s powerful analysis and reporting engine goes far beyond all competitive offerings when it comes to closing the loop on continuous process improvement. This is because of our rich, optimized relational database that is tuned to enable our customers to get the most value from process data.
GainSeeker’s unique data analysis and reporting capabilities include:
- Ad hoc query lets you get the data you need fast
- Desktops let you get back to your favorite views in one click
- Enterprise dashboard rolls up easy-to-understand summary views of performance
- One-click data grouping and drill down capability make ad hoc query intuitive
- Analysis Wizard automatically points to underlying sources of variation buried in the data
- Multi-Chart tools make it easy to compare and evaluate data across features and across time
- Defect Management System second to none
Summary of Hertzler’s unique business perspectives
Finally, when you purchase SPC software, you’re not just buying software, you’re partnering with a supplier. Hertzler Systems brings these attributes to the relationship:
- Disciplined deployment and training strategy
- Employee owned and operated
- Our customer’s success is our success
Unique data acquisition capabilities – supporting detail
Data entry forms that are easy to navigate
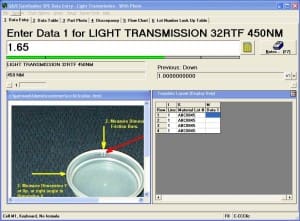 GainSeeker is designed especially for a shop floor environment. The screens are laid out with prompts in large letters and big boxes so there is never any doubt where you focus your attention.
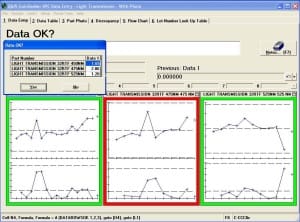
The screen at the right shows an operator interface for manually entering data for several features. The instructions “Enter Data 1 for LIGHT TRANSMISSION 32RTF 450NM” are clear and unambiguous.
Interfacing to any device or system
GainSeeker interfaces to any device or system. A partial list of these includes:
- Gages
- Sensors
- Balances
- Any device with RS-232 output
- Flat files
- Databases
- Web pages
- Devices or software with DDE
- OPC devices (PLC Interface)
- Analog gaging and sensing equipment
- And of course keyboards, bar code readers, touch screens and other standard equipment
Special wizards (File Import Wizard and the Database Integration Wizard) make it easy to connect to text files and databases.
Automated real-time charts and alarms with feedback to people or equipment
Real-Time SPC Alarms (GainSeeker Suite SPC Software)
GainSeeker generates real-time control charts as users enter data. The system checks these using standard (user-configurable) Western Electric Controls tests.
If the system identifies a shift in the process or a special cause situation, it automatically lets the operator know immediately. Email notices can be sent automatically to engineers or quality staff.
The system can additionally turn on lights, sound alarms, play music and so forth to let people know that something has changed.
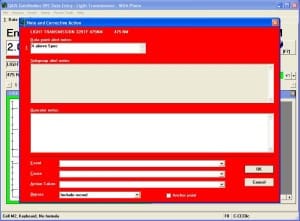
The system can feed back information to manufacturing equipment. For example, if the system detects a trend of seven points on one side of the mean, it might give the process owner a notice in the form of a big red alarm window (shown at the right). It can also send an email to the process engineer in charge of the line, and send a message to a PLC instructing the PLC to set itself to a new target to accommodate the shift.
Automatically calculate derived features
GainSeeker can calculate derived features based on intermediate values, constants, or data from 3rd party systems (such as costs from a raw materials purchasing system). For example, in one recent project GainSeeker captures thickness of 6 different layers at each of 5 points on a bottle.
From this information, GainSeeker calculated total volume, average wall thickness, total weight, and percent by weight and total wall thickness. From 30 entered values, GainSeeker was able to calculate 32 more variables that were useful to this customer.
Integration with other business systems
GainSeeker integrates well with other business systems, including ERP and MES software. This integration saves time because it eliminates double data entry, and it reduces errors. This is crucial for GainSeeker users because of the unique drill down and analysis capabilities that we’ll address later in this paper.
Linking to other business systems lets users capture the critical x (inputs) information at low or no cost so that you can use that data to drive process improvement.
Customizable work flow control
Unlike other SPC systems, GainSeeker lets you design and build custom data acquisition solutions so you can control exactly what your operators do, when they do it, and how they do it.
Other systems give the user a form or spreadsheet and tell them, in not so many words, “Go ahead and fill this form out. Good luck getting the right information in the right place.”
GainSeeker doesn’t work that way. It guides the user through the inspection process so that it is always done the same way and the data that the user enters is complete and accurate.
Document delivery solutions
In addition to displaying up-to-date real-time control charts, GainSeeker Suite can also deliver:
- Work instructions
- Product drawings
- Inspection checklists
- Engineering-approved deviations
- Video assembly training
- A corporate intranet
- and more
This data can all be linked back to specific products, greatly simplifying setup and maintenance.
GainSeeker’s analysis and reporting capabilities
Most real-time SPC systems offer at least some of the features that GainSeeker provides for real-time data acquisition and alarming.
Where GainSeeker stands head and shoulders above the other systems is in its ability to make sense of the data you collect and close the continuous improvement loop so you gain the greatest possible benefit from your quality data asset.
Ad hoc query lets you get the data you need fast
When it comes to making sense of your data, GainSeeker gives you easy-to-use ad hoc query tools so you don’t have to be a programmer to get to your data.
You select a feature and a chart type. If you want you can also select a time period and to filter the data by some traceability information.
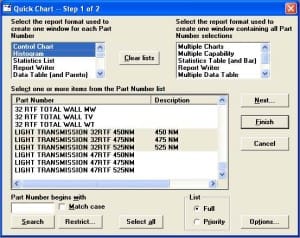
In the illustration on the right you can see how we’ve selected to view a control chart and histogram for two features. If you click the Next button you can select filters (to see one shift, or a particular machine’s data, for example), or time periods. You can select from predefined periods (Today, One week ending today, Current Week, and so forth) or free form data selections.
A few clicks get you to the charts you need to see.
Desktops let you get back to your favorite views in one click
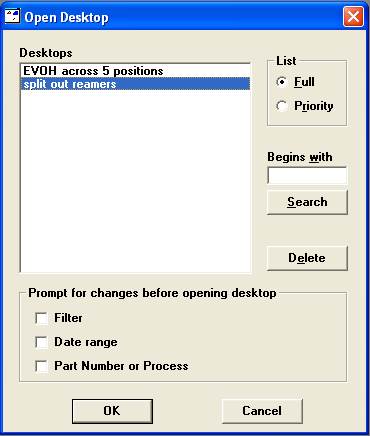
Once you have the data that you want to see, you can save that view of the data as a desktop so that you can come back to it any time. And you can make the dates of your retrieval relative.
For example, if every day you want to look at a collection of combination charts (control charts and histograms) with summary statistics for a collection of features on one line for the last seven days, you can save all of these criteria as a Desktop. Then with one click you can get the charts you need, in exactly the format that you’re used to seeing.
Furthermore, you can email a copy of this desktop to anyone in just one more click, or save it to a web page. GainSeeker’s Desktops make it easy to view routine reports.
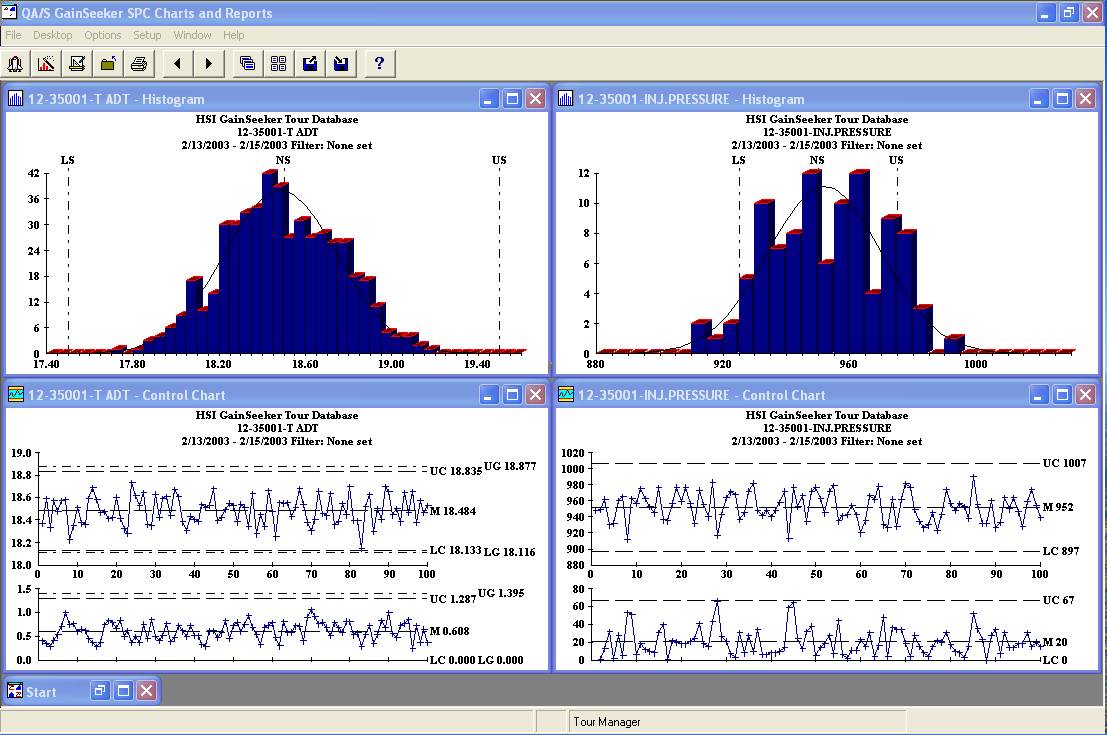
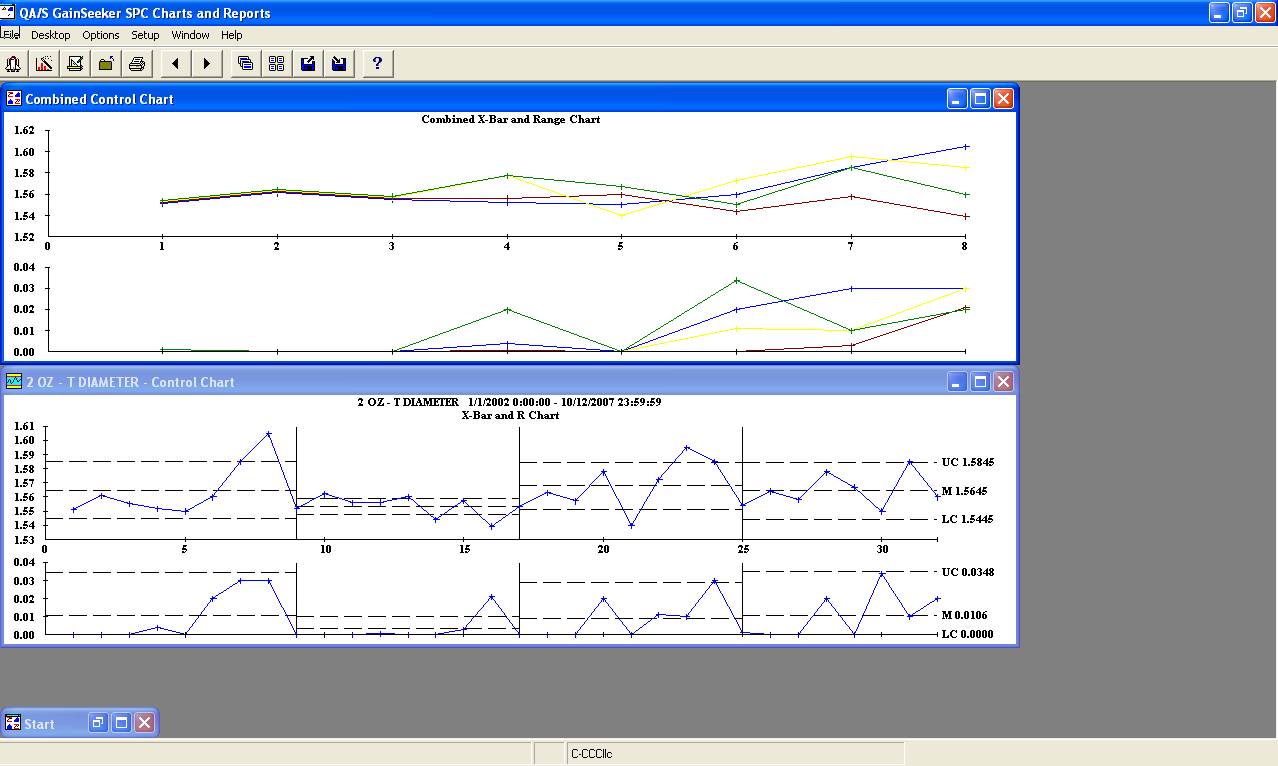
Here is a sample desktop for one parameter, split out by reamer. On top you can see data for all reamers on a combined control chart. On the bottom, you see each reamer side by side. Once this is setup, it just takes one click to see the data in this format every day.
Enterprise dashboard rolls up easy-to-understand summary views of performance.
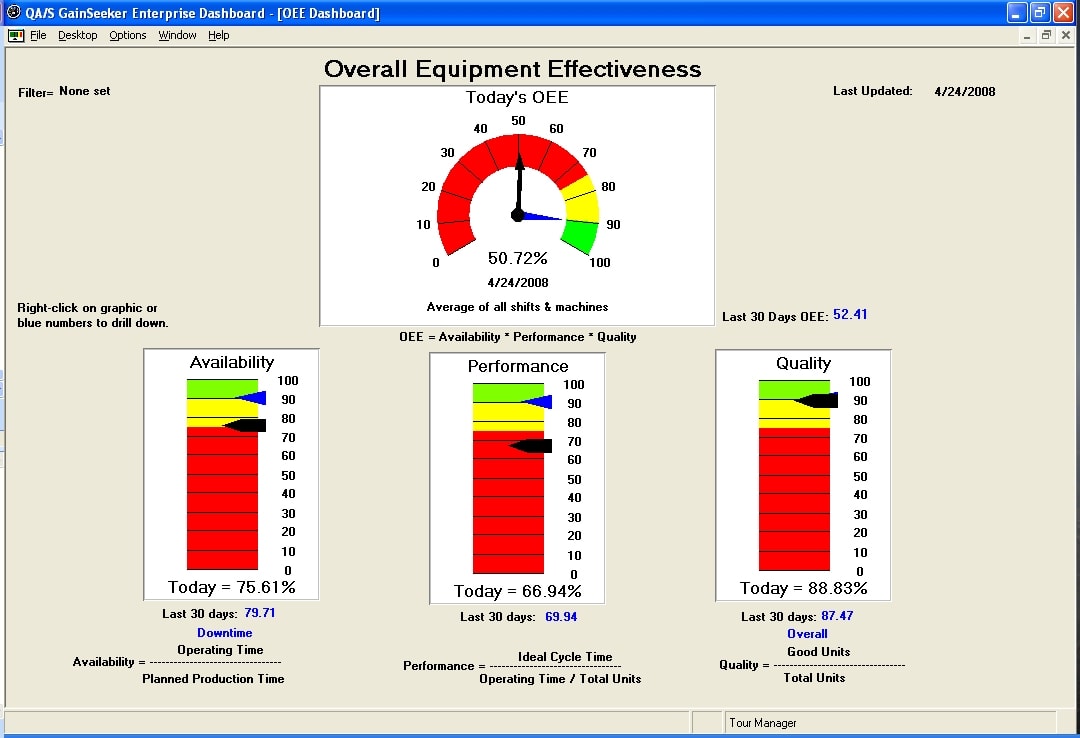
The latest addition to the GainSeeker Suite is the Enterprise Dashboard module. It rolls up and summarizes in easy-to-understand graphics and tables so that everyone who needs data can see what is important to them.
From the shop floor to the executive suite, the Enterprise Dashboard delivers current knowledge. And if you need to get to the data behind the dashboard, it is just one click away.
The sample presented above is just one collection of ways you can display data on a dashboard. The system is easy to configure so each user can set up their own dashboards that display only the data they need.
No other SPC System presents data in this kind of a Dashboard Format.
One-click data grouping and drill down capability make ad hoc query intuitive,
Sometimes there are patterns of variation that are hidden within your data. If you could just get to the underlying data, you could understand what caused the variation.
GainSeeker’s One-Click Data Grouping and Drill Down provide that capability. No other system on the market provides this feature.
Here is a control chart for a single feature.
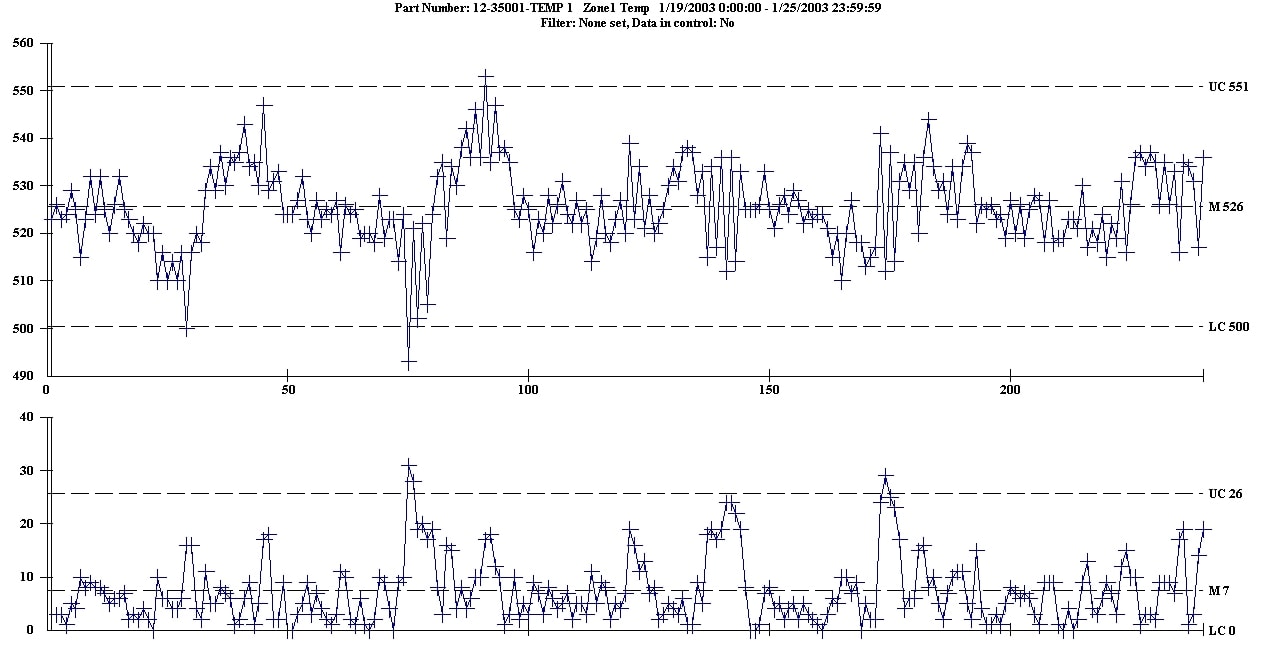
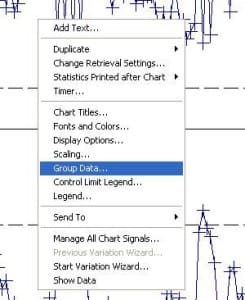
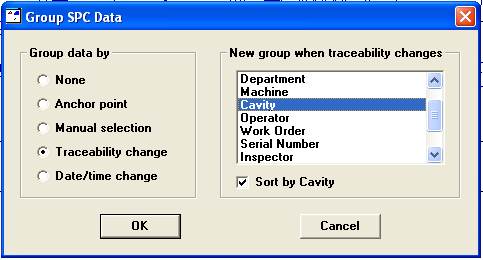
If you right-click on that chart in GainSeeker, you can select to Group Data…
Here is one of the most exciting capabilities in GainSeeker Suite. When you select to group data you have the ability to sort and group data by any traceability information that you’ve collected about this data set.
For example, if you group the data by Cavity, you can see the chart laid out like this:
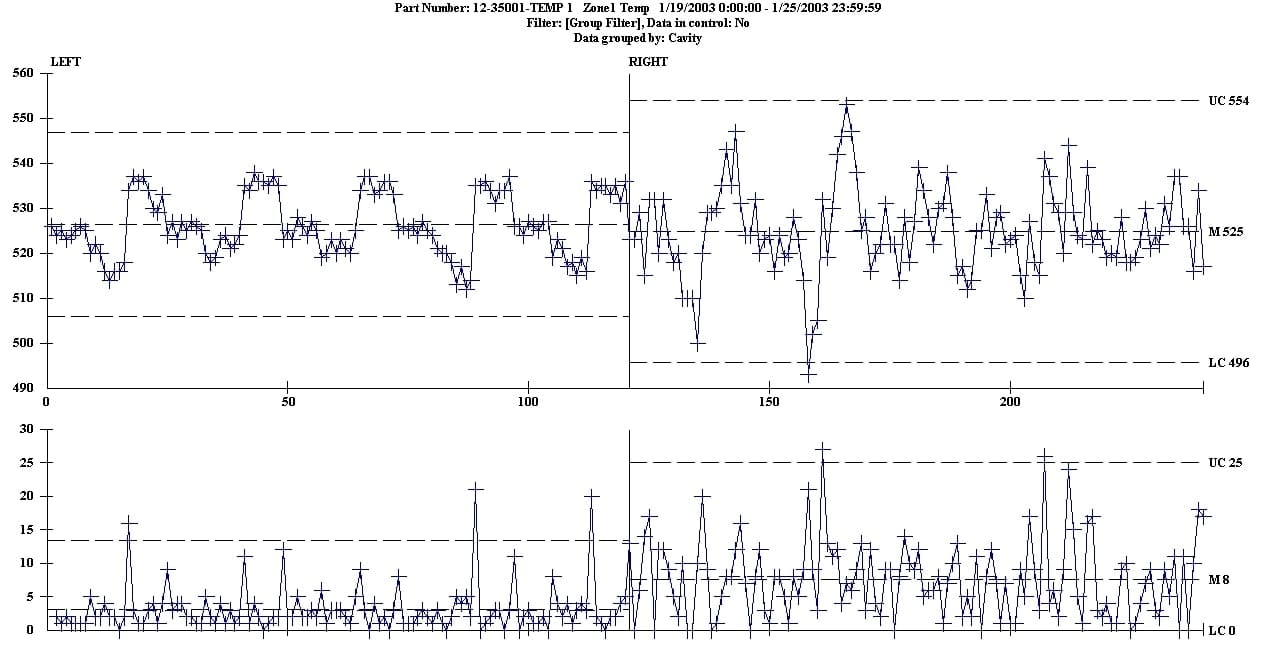
It quickly becomes apparent that that there is a significant difference in the variation between the left and right sides of this mold.
But you don’t have to stop there.
You can Drill Down into one of these cavities and see if you can find an underlying pattern or cause of the variability in that cavity. For example, by Drilling into the Left Cavity, and then Grouping that data by Shift, the differences between Shifts 1, 2 and 3 leap out at you:
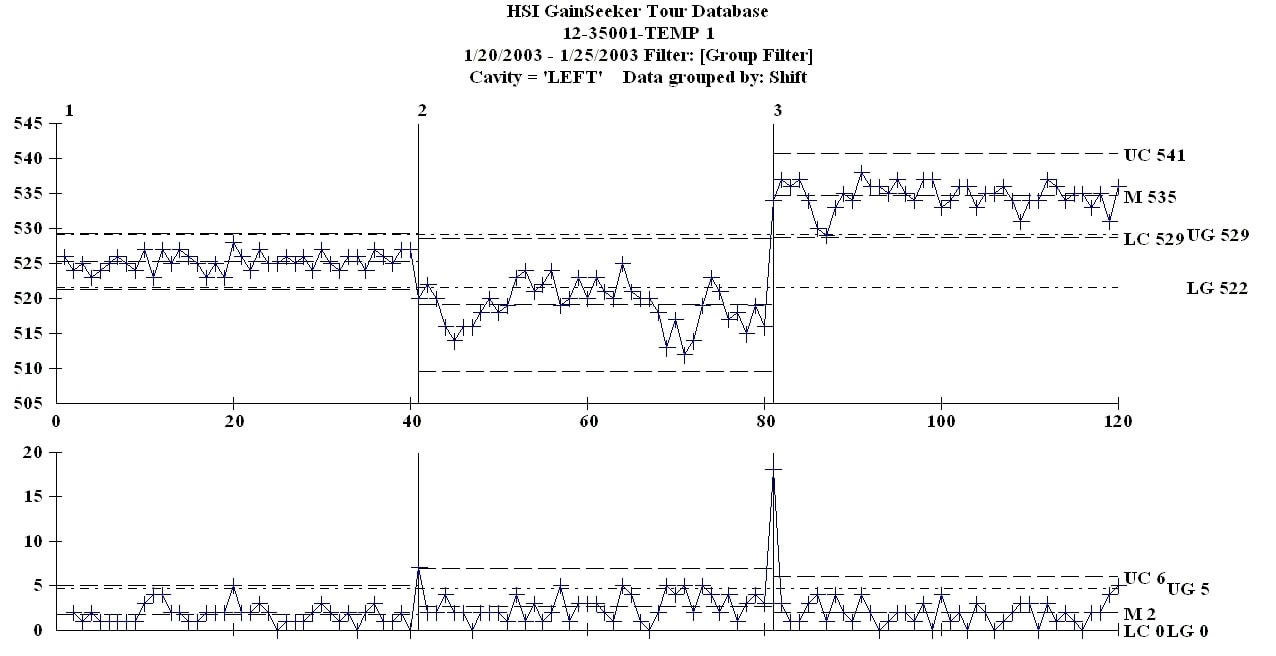
This level of analysis is available with just a few clicks, and requires no knowledge of query language or databases or programming. Only GainSeeker provides this capability.
Analysis Wizard automatically points to underlying sources of variation buried in the data.
The Group by and Drill Down features are unique, but Hertzler’s innovative development staff didn’t stop there. Our team wanted to make GainSeeker the most intelligent system on the market. Besides, with dozens of traceability fields available for every data set, even one-click drill downs can become laborious.
That’s why the team designed the Analysis Wizard.
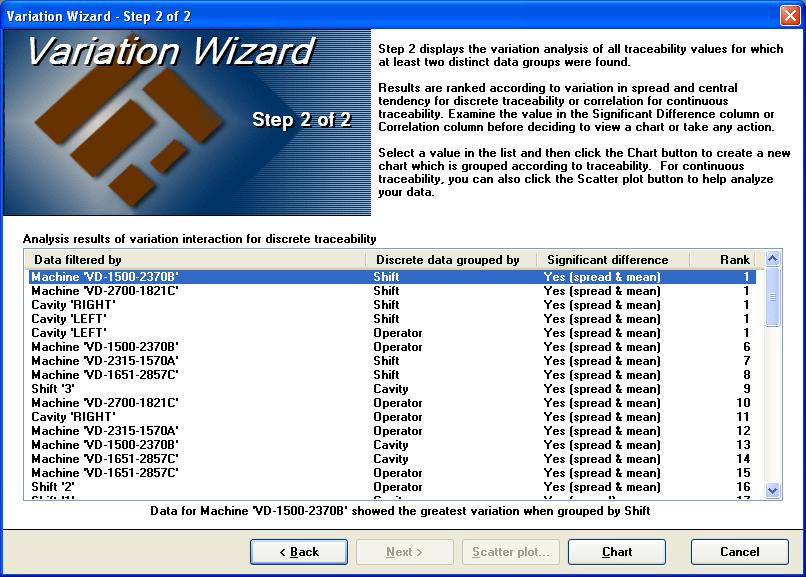
The Analysis Wizard takes the grunt work out of drilling into data to look for sources of variation. It automatically slices and dices data and looks for relationships within your data. Based on standard statistical tests for variation it ranks the impact different combinations of input variables have on process variation, and summarizes the information in an easy-to-read table.
Here, for example, the system has just crunched though thousands of data points and determined that when you select data for Machine ‘VD-1500-2370B’ and then group the data by shift you’ll find the greatest source of your variation.
The Analysis Wizard is unique among all SPC and advanced statistics tools.
Multi-Chart tools make it easy to compare and evaluate data across features and across time
All of the powerful ad hoc query tools in GainSeeker make slicing and dicing data available to anyone – not just software experts. When you combine these tools with our Multi-Chart data views, you have almost unlimited capability to visualize your data in new and eye-opening ways. Here are a couple of examples.
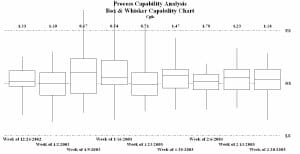
At the right is a quarterly report showing the distribution of a particular feature over one quarter, week-by-week. This report requires no special programming techniques or skill to develop. Everything is available with a few clicks of a mouse. Or it can be set up as a desktop and refreshed with just one click.
Another way to look at data is to compare multiple features together over time.
The Combined Control Chart shown below places five different features on the same chart, with the same scaling. In this situation, each feature is actually a very expensive layer of plastic in a plastic bottle at five different positions around the bottle.
From this type of analysis, an engineer can readily see where he needs to make adjustments to get all positions on the bottle to the same thickness. Once he solves that problem he can set out to optimize the thickness to use the least amount possible of the expensive material.
Without this type of information, the engineer is working in the dark. With this information available at the click of a button, he can quickly make adjustments and monitor his progress. And once he has the process where he wants it, GainSeeker’s real-time data collection and alarming gives him confidence that he’ll know instantly if something changes.
Defect Management System second to none
So far all we’ve touched on in this white paper are tools for real-time data collection and analysis of variable data.
GainSeeker has the most powerful defect tracking and management system on the market.
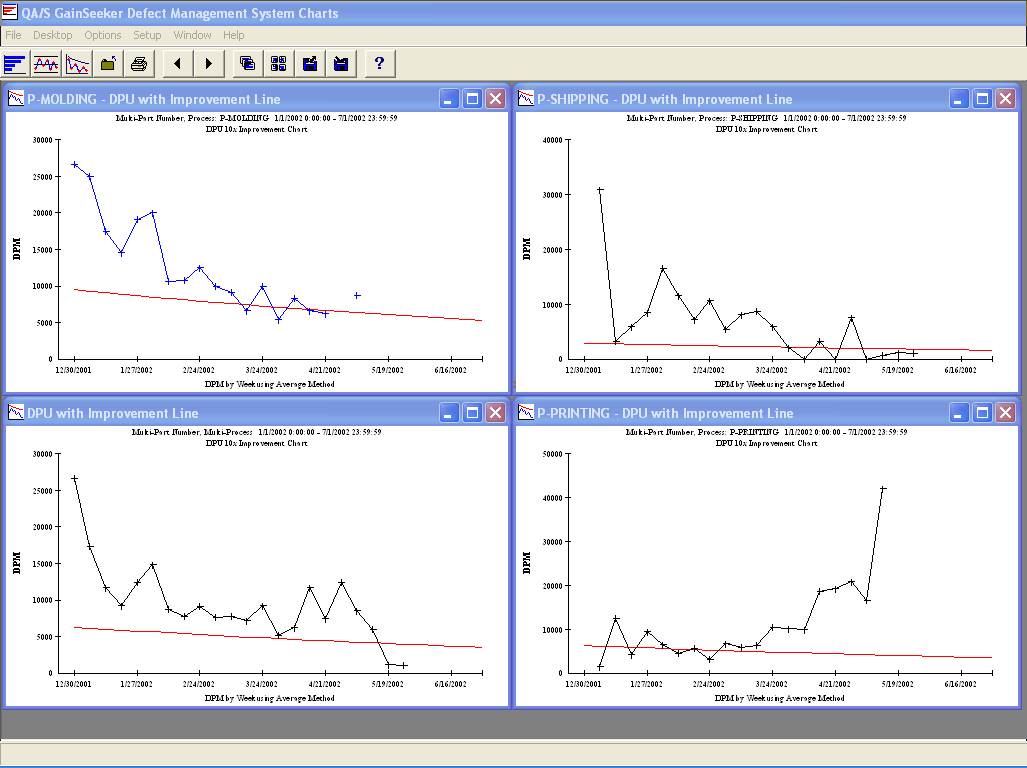
Here, for example, are DPU charts for three processes, with a rolled up summary chart that shows the total performance across all three operations.
A system like this is easy for everyone to understand. We can readily see that although overall our business is improving, the process described in the lower right corner is actually getting worse. You don’t need to understand control limits or Cpk to get this message!
But of course GainSeeker doesn’t stop there. The system is powered by unique drill down Pareto Charts (including a Pareto Drill Down Wizard) that let users drill into the top defect and look at it by Product, Line, Shift, Operator, and so forth.
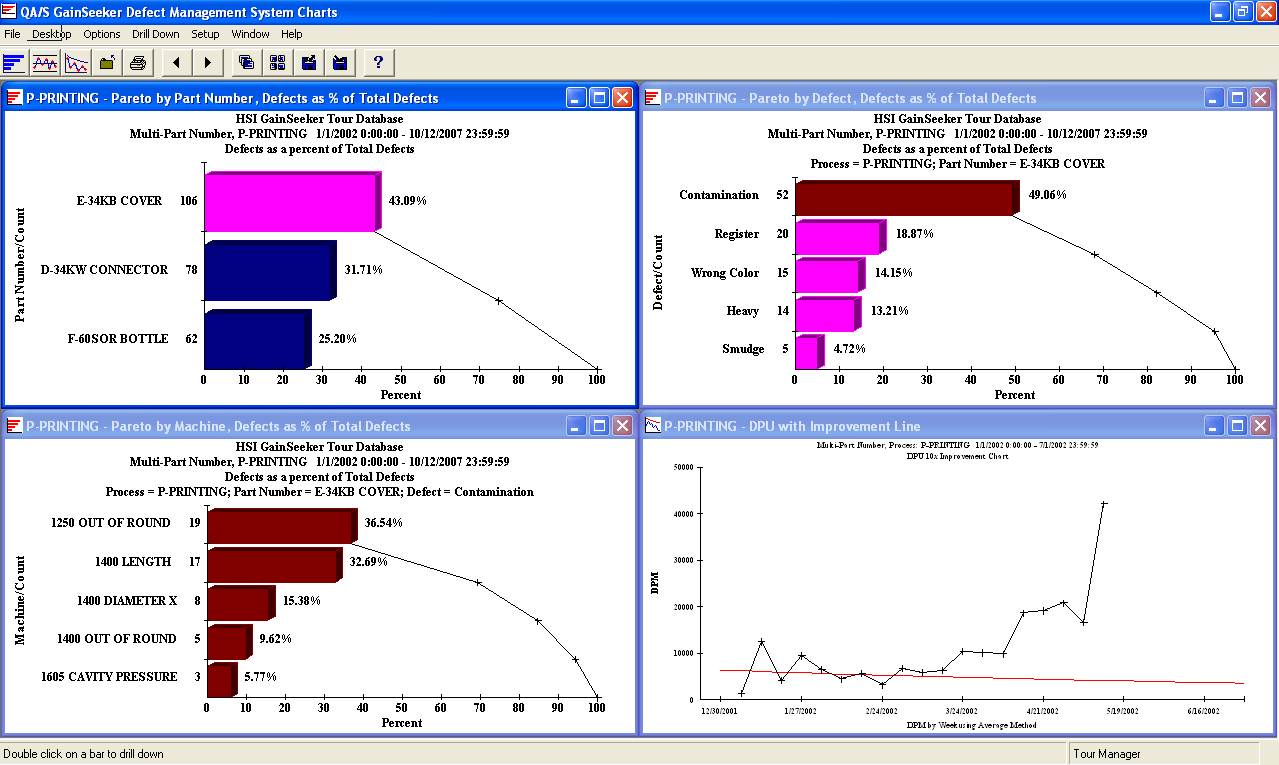
For example, below you can see how we drill into the data for just the errant process. We can sort it by Part Number (upper left chart), and then drill into the top Part Number to see which Defect (upper right chart) is contributing the most problems. Then we can click on that defect and see which Machine (lower left chart) is causing the most Contamination defects. We can keep going as long as we want, or return and follow different paths through the data to find where we should spend our precious resources to solve our biggest problems.
Of course cost data can also be captured and used in analysis.
Summary of Hertzler’s unique business attributes
Software should be only part of what you consider when you purchase an SPC Solution. Hertzler Systems doesn’t just sell software, we partner with you make sure you get the most value from your data. We know that we can’t be successful in business if our customers aren’t successful in driving costs and waste out of their businesses so they are competitive in our global economy.
Here are some attributes of our company that you’ll come to appreciate as you get to know us better.
Disciplined deployment and training strategy
We don’t just sell you software and hope you can do something with it. We’ll actively work with you to plan your training and deployment strategy so that you get off to a solid start and see rapid gains from your deployment.
Because GainSeeker is so adaptable to so many applications, we typically work with your team to configure GainSeeker for your particular needs. We design a training plan that fits your needs and your staff, and we work on a project basis to build any custom interfaces, desktops, or dashboards that you need.
You’ll find that we’re a very disciplined team. We plan our activities carefully. We dislike surprises as much as you do and we bend over backwards to align our efforts with yours for maximum productivity.
Employee owned and operated
Hertzler Systems is employee owned and operated. At some point you’re likely to meet the two people at the top of the business (Evan Miller, President, and Byron Shetler, Chief Technology Officer). They have a personal commitment to our customer’s success.
In addition, many of our staff members have been with the company for years. We’ve watched each other’s kids grow up, and we bring a mid-western work ethic and down-to-earth business values to our efforts. We say what we mean and mean what we say. We tell the truth, even if it is unpleasant news. And we genuinely care about doing the right thing. We’re in this for the long term, not to make a quick buck and leave our customers hanging.
Our customer’s success is our success
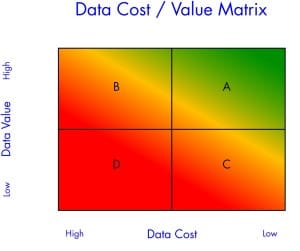 Our business can’t exist if we don’t help our customers be more successful. We help customers get more value from data, and we help them reduce the cost of data. The Data Cost / Value Matrix is a useful image to visualize this.
We help our customers move to the upper right quadrant of the Cost/Value Matrix. The movement is very cost effective, and our customers typically report ROI in weeks or months, not years.
We know this is so important that we now offer a free interactive Gap Analysis (Note: you must have Adobe Flash Player installed) to help you identify where you company is on this matrix. You’ll learn what you can do to move towards High Value / Low Cost data and become a data-driven organization.
Open this as a PDF in a new window

