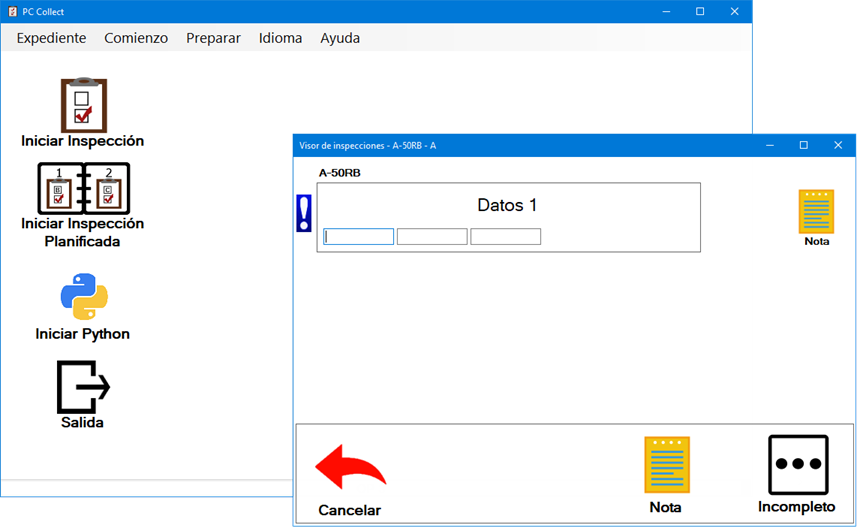
The PC Collect module can now display all menus, prompts, windows, etc. in Spanish or French (as well as English). This makes it much easier for data entry users to understand and interact with the PC Collect module for data entry.
The language used by PC Collect can be set by a command line parameter, a language setting for the GainSeeker user, or the language currently being used by Windows. The user can also use the menu to manually change the language.
These changes also make it possible to enter and edit data, standards, etc. in non-legacy modules such as PC Collect and GainSeeker Charts when the Windows language uses a comma or other symbol as the decimal separator.
For details about running PC Collect in another language, see Setting the PC Collect Language to Spanish, French, or English.
A new login.language Python command makes it possible to display different custom messages based on the current PC Collect language.

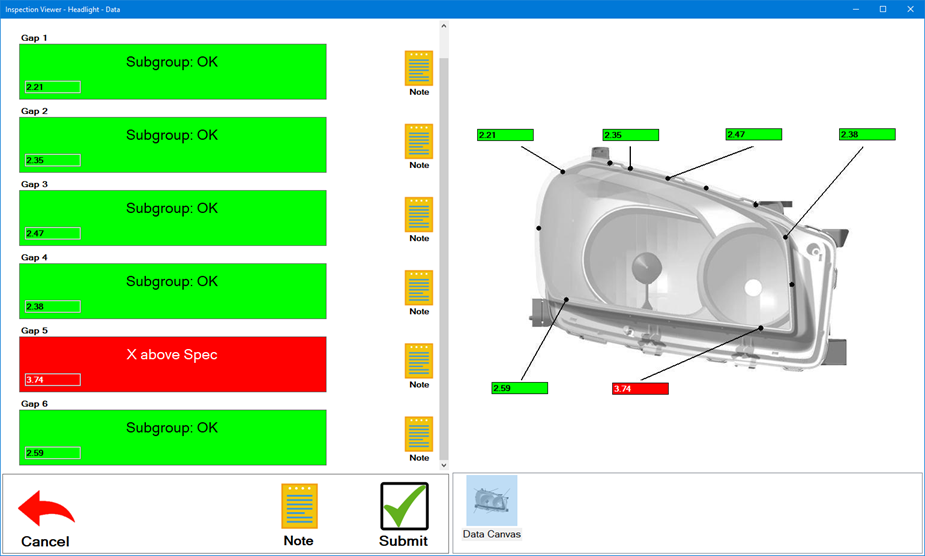
A sub-inspection with Numeric Input tests for measurement data can now display those tests on the side panel in a Data Canvas. As the user – or a connected device – enters data for these Numeric Input tests, those values are also displayed at the corresponding locations on the Data Canvas.
For a sub-inspection with many Numeric Inputs, this helps the data entry user to quickly understand which measurement is generating real-time alarms and immediately take appropriate steps.
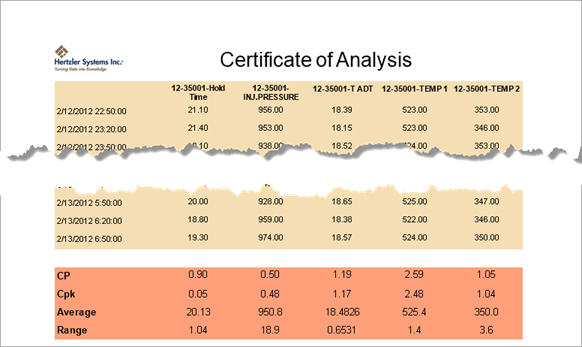
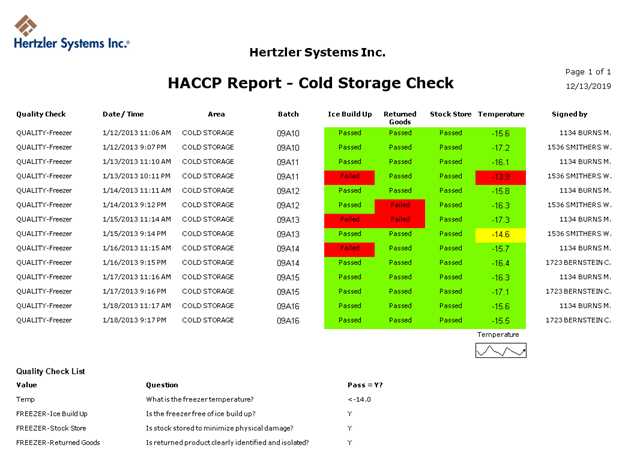
A new version of Dynamic Reports – Dynamic Reports 2 – is easier to work with when designing reports, and it offers new functionality such as data retrievals based on Python scripts and support for GainSeeker custom statistics.
Any existing reports can be automatically imported into the Dynamic Reports 2 platform.
You can now ensure that Numeric Input tests and their corresponding side panel charts are filtering for the same values when calculating Control Limits for real-time failures. For more information, see Numeric Input Filter property, Numeric Input AutoSendRTFEmail property, SPC Chart Options, and DMS Chart Options.
Charts are now drawn more quickly in PC Collect, and we have streamlined how often we update those charts to speed your process of data entry.
There is also a new set of Python inspect.sidepanel commands for side panel charts (and other tabs on the side panel) to give you better control of what is displayed on the side panel during inspection data entry.
GainSeeker is now tested and supported on MINITAB 19.
By default, GainSeeker is configured to work with MINITAB version 19. To configure your workstation for a different version of MINITAB, see Configuring GainSeeker for the correct MINITAB version.
For new deployments using iPads or other mobile tablets for data entry into GainSeeker, Hertzler Systems now recommends the use of a Microsoft Remote Desktop Client app to connect to a PC (or Remote Desktop Session Host server / Terminal server) that runs the full GainSeeker client.
This permits the use of Python scripting to customize data entry inspections and lets you take advantage of the growing list of data entry features available for the PC Collect module. This also makes it easy to create one inspection that works correctly on both PC and mobile platforms.
This new recommendation supersedes earlier recommendations to use the GS Collect app (which supports LiveCode scripting but not Python scripting) and the GainSeeker Mobile Web Service for iPad data entry.
For details, see Mobile App Requirements.
The Workstation Requirements for GainSeeker now include Microsoft .NET Framework version 4.6.2.
If upgrading GS Analyze from a previous version, you must update the web.config file on the web server.
When installing the GainSeeker client for a new version of GainSeeker, the Table Creation Utility now only runs on the first client. This improves the functionality of installing GainSeeker clients in silent mode.
Database scripts and instructions for Setting up GainSeeker on a SQL Server database have been updated for the database administrator to manually create the GainSeeker database instead of letting the script create the database.
Documentation for Setting up GainSeeker on a SQL Server database has been updated with instructions for changing SET NOCOUNT to OFF.
Documentation for installing the GainSeeker client has been updated with troubleshooting information for errors on a UNC path to the Shared data folder.
A new Monitor Table Colors and Priority setting in System Administration now determines how colors are applied to the Monitor Table in the GainSeeker Charts module. Monitor Table colors can now be based on either the real-time failure colors (like previous versions) or on color rules that you define, based on traceability and corrective action values in the data.
Surge licenses are now available to temporarily increase
your GainSeeker license count until a specified expiration date.
This can be useful when you temporarily increase the number of
concurrent GainSeeker users - for example, when employing summer
interns to work on GainSeeker projects, or when conducting a GainSeeker
training class.
For information on installing a Surge license, see Importing
a License File.
If you change a defect name, GainSeeker will now generate a list of the inspections and Python scripts that you may need to manually update to use the new name. If the old name contained one of six special characters (< > & \ " or '), some of the inspections and scripts displayed may not actually require updating.
If your computer has a microphone, you can use built-in Windows functionality to speak text and characters instead of typing them on the keyboard. This can be used in any part of GainSeeker where you are expected to enter text, such as fields for data or notes. For more information, see Convert speech to text with Windows dictation.
By default, GainSeeker charts and dashboards now display the "Powered by GainSeeker" watermark in the upper left corner. You can turn off this watermark for all configurations by clearing the Hide "Powered by GainSeeker" watermark in GainSeeker Charts check box in System-wide settings.
When selecting a default report for Statistics List, Statistics Table, or any of the Statistics under... settings, you can now copy the Default report to a new report.
You can now use inspections with Python scripts to read data from Solartron Orbit 3 devices. This is implemented with a new Numeric Input test property SolartronSettings, new Python solartron commands, and a new Python inspect.cursubi.ni(idx).solartronmoduleid command.
The FormulaMode
property of a Formula test has a new ClickToggle
option that lets the inspector click a button to start running
a script, which runs repeatedly until the inspector clicks the
button again to finish running the script. This is especially
useful in conjunction with the new Data Canvas feature (above).
A new RunningLabel property
for the Formula test also sets the label for this button while
the script is running, and this label can be changed by the new
inspect.cursubi.formula(idx).labelwhilerunning
Python command.
A new sub-inspection property, CombinedFailureResponse, lets you send an email notification for all Numeric Input test on this Sub-Inspection that were submitted with real-time failures. It is useful for situations where one sub-inspection might have multiple Numeric Input tests that fail and you prefer to receive one summary email for the sub-inspection instead of a separate email for each Numeric Input test that failed on the sub-inspection. A corresponding Python command, inspect.cursubi.combinedfailureresponse, is also available.
When editing LiveCode script, GainSeeker now uses a monospaced font in a larger font size to improve legibility.
Deleted Device Profiles for RS-232 input are now logged to the Audit Trail.
Documentation for performing Numeric Input tests now includes instructions for completing the subgroup when a measurement is missing.
During RS-232 data entry, if the inspector presses CTRL+K to enter a data value via keyboard, they can now enter an asterisk ( * ) in place of a missing measurement.
On a Numeric Input test with real-time failures, font colors on the test and its individual note are now automatically adjusted for legibility against backgrounds with darker real-time failure colors.
You can use the new commands disp.btnaccept() and disp.btncancel() to configure custom forms that allow the user to press the Enter key or Esc key instead of clicking a button on the form.
The new inspect.cursubi.trace(idx).getindex() command gets the number of the traceability field assigned to a particular Traceability test.
The new commands inspect.cursubi.defectlist().visible and inspect.cursubi.dmspart().visible let you change (or get) whether a Defect List test or DMS Standard test is visible.
The new inspect.cursubi.ni(idx).getrtfnote() command gets any real-time failure notes that were automatically generated during data collection for this numeric input test.
The inspect.cursubi.ni(idx).note command now returns None whenever there is no individual note for the numeric input test. (In previous versions, this would return None if no individual note had been set, but if an individual note had been set and then cleared it would return an empty string.)
Two new options allow you to create a customized password
verification form for audits, electronic signatures, Title 21
CFR Part 11 compliance, etc.
One option is the new disp.dialogs.enterpassword()
command, which displays a standalone dialog that prompts the user
to enter their password (using the prompt text that you specify).
and verifies that the password is correct.
Alternately, you can use disp.newtextbox()
with the new .usepasswordchar
property to display the system password character (•) when the
user enters their password, and then use the new login.verifypassword()
to verify that the password is correct.
The new disp.dialogs.selectdateperiod() command lets you prompt the user to select a date period using the standard GainSeeker date period dialog.
When displaying a form with the disp.newnumeric() numeric entry control, any text in that control will now be automatically selected when it is the first control when the form opens and when the inspector uses the Tab key to move to that control. This makes it easier for the inspector to see which control has the focus, and it makes it easier for them to Tab to that control and quickly replace its existing value with a new value.
The commands datadms.store() and dataspc.store() now trim leading and trailing spaces from traceability fields before storing GainSeeker database records.
The sql.tables commands have been updated to include more GainSeeker table names.
For the special variable result in Device Profiles, you can now set this variable to an asterisk ( * ) in place of a missing measurement.
When debugging a Python script, any values that you print to console are displayed in the upper right panel. When a new value is added to this panel, the debugger now automatically scrolls to the end so that the newest item is displayed. You can now clear the text in this panel by clicking the panel and then pressing Ctrl+Delete. This is makes it easier to debug a Python script that prints many values to the console.
When the Python Script Editor has been launched from the Inspection Editor main window, minimizing the Script Editor window will now also minimize the Script Display Host window and the Inspection Editor.
Documentation for the special variable result in Device Profiles has been updated to note that if the inspector clicks Cancel while waiting for a reading from the Device Profile, this variable will be set to None.
Documentation for the disp.addbtn() command has been updated to note that up to three buttons can be displayed on the form.
Documentation for the inspect.sidepanel.addwebpage() command has been updated to include the option of sending an HTML string instead of a webpage URL.
Documentation for the inspect.cursubi.ni(idx).note command has been updated to clarify that this command does not include any real-time failure notes that were automatically generated during data collection.
Documentation for the statspc and statdms commands has been updated to note that code completion must be used to access the full list of available methods for statspc.data, statdms.data, statdms.dpu, statdms.oee, and statdms.pareto.
Documentation for the serial[x].readall() command has been updated to clarify that this command does not prompt the user or wait for a new value to be added to the buffer.
Documentation for the serial[x].readcolumn() and serial[x].readline() commands has been updated to note that if the inspector clicks Cancel, these commands will return None.
Documentation for the sql.execute() and sql.gettable() commands has been updated to note that these commands can be used to run a stored procedure on the database.
Documentation for the file.xls.getrow() command has been updated to note that when reading a .csv file, if the cell can be interpreted as a numeric value, its value will be formatted without any symbols such as currency, percent, or scientific notation.
Documentation for the file.xls.getcell() command has been updated to note that when isNumeric is False and you are reading a .csv file, if the cell can be interpreted as a numeric value, its value will be formatted without any symbols such as currency, percent, or scientific notation.
Documentation for the file.xls.getcelldt() command has been updated to note that when hastime is True and you are reading a .csv file, time stamps do not include seconds.
You can now configure the GS Console Manager to display different colors based on row contents.
Several new Role permissions now allow you to run GS Console Manager in read-only mode.
You can now limit user access to the Start Group and Stop Group buttons by changing the GainSeeker user's Role permission for Miscellaneous >> Execute Non-Embedded Python Script, Start & Stop GS Console Manager Groups.
You can now limit user access to the Set Up button by changing the GainSeeker user's Role permission for Module Access to Data Entry Template Designer, GainSeeker Inspections, & GS Console Manager Setup.
When viewing a particular Group, the Start
Group button is only available if the group is not already
running (a stop file exists for that group).
Similarly, the Stop
Group button is only available if the group is already running
(no stop file exists for that group).
Instead of displaying the machines for a single Group, you can now choose -All Groups- to display and work with all machines - regardless of the Groups they are assigned to.
When saving a Chart Skin, you can use the new Save to All Configurations button to save the Chart Skin to all GainSeeker configurations.
Two new dashboard properties now allow you to run a Python script before the dashboard opens. The new PythonRunBefore property will only run once before the dashboard opens, while the new PythonRunAtRefresh property will run before the dashboard opens or refreshes.
The 64-bit version of GainSeeker Charts can now perform all of the same functions as the 32-bit version - including all functions associated with copying dashboards to the clipboard.
A new chart setting Hide text above markers lets you hide the short labels for corrective actions on charts where there are too many corrective actions to be legible.
The topics for 64-bit version of GainSeeker Charts and Tables and Files used in GainSeeker 9 have been updated to note that the 64-bit version of GainSeeker Charts uses the Redirect.hsi from a different location than its 32-bit counterpart.
Several functions that previously used the clipboard to save dashboards or dashboard controls to an image (including the Slideshow), to HTML, or to PowerPoint have been updated to achieve the same result without using the clipboard. This is useful for network systems where the clipboard cannot be used. This also eliminates the need for the TimerExportSafeMode dashboard property, which has been removed.
When editing a dashboard that had a timer set, mouse and keyboard interactions (such as editing properties or Python scripts) became very slow each time the timer triggered another refresh. GainSeeker will now pause all timers set for the dashboard while that dashboard is opened in Design mode.
For Combined Control Charts, a new chart setting Statistics under combined control chart determines which statistics are displayed below the chart. Also, this type of chart now ignores the Show statistics list under chart setting and always displays statistics below the chart.
When you use the File menu or Desktop menu to Print Desktop, the Print Desktop window now more accurately reflects the current settings for Landscape or Portrait and for Frame Charts.
When sending a dashboard via email, the email contents and attachments are now the same whether the email is sent via SMTP or Outlook.
An .rtf file containing all of the dashboard controls will always be attached to the email.
If sending the email as HTML a .jpg image of the dashboard will be embedded in the body of the email.
Charts and dashboards now display the "Powered by GainSeeker" watermark in the upper left corner. This can be disabled by the new System-wide setting Hide "Powered by GainSeeker" watermark in GainSeeker Charts.
OEE Time Charts now display more tick marks on the x-axis.
OEE Charts with first-level grouping by Traceability and up to 55 primary groups now display the x-axis label for each bar, (In previous versions, only some of the x-axis labels were displayed at certain intervals.)
Commands on the File menu are now displayed in a different order so that similar items are more intuitively grouped together.
You can now use Report Transfer to export, import, or delete any Settings that were saved for the Import/Export data function. Deleted Settings are logged to the Audit Trail.
You can now use Report Transfer to export, import, or delete any Device Profiles for RS-232 input (used by Numeric Input tests in Inspections). Deleted Device Profiles are logged to the Audit Trail.
When changing the settings for a Role, the label for the permission Module Access >> PC Collect has been changed to Module Access >> PC Collect & GS Console.
You can now use the Roles tab to view the internal ID number that was automatically assigned to any role.
When the default report has already been selected for any of the Statistics under... settings, a new Default option is now available so that you can return to default statistics for that chart type.
If upgrading GS Analyze from a previous version, you must update the web.config file on the web server.
Documentation for Changing a database server has been updated for clarity.
Documentation for calculating the Pp statistic has been updated to explain how Pp is calculated for unilateral specifications.
Documentation for Finding and selecting standards has been updated to better explain how to use Regular expressions (regex) to search for standards that start or end with the value you specify.
Documentation for the OEE Chart Settings Display bars for OEE charts and Display values for OEE charts has been updated with additional details.
Documentation for the Role setting Send To >> Printer Or Editor has been updated with additional details.