The GainSeeker Installation and upgrading instructions for the System Requirements have been changed to reflect this information:
For more information, see Installing or Upgrading GainSeeker
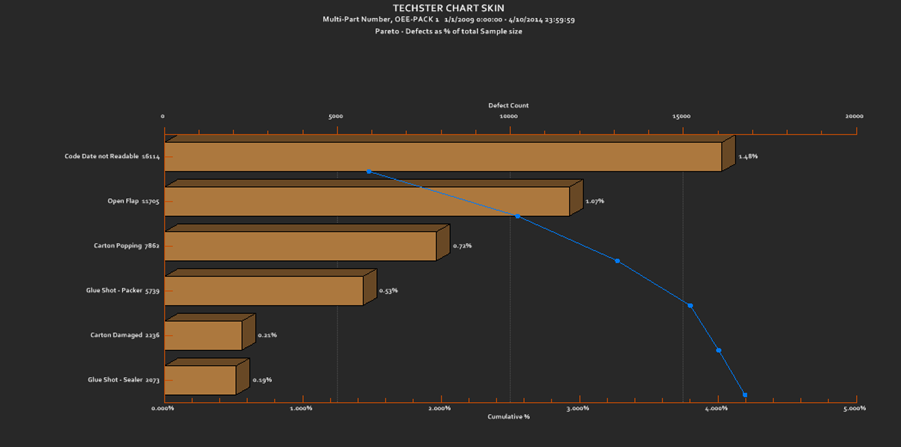
Now you can save multiple display settings as a chart skin that can be easily and quickly applied to charts. While this makes analyzing data more visually engaging, it also has practical applications. All settings in the Charts Overrides node of the charts Settings dialog in the GainSeeker Charts module can be saved as a DMS or SPC skin, including what limits to display, how data is scaled, chart titles, and more.
You can also apply a Chart Skin to a Dashboard chart
GainSeeker System administrators might want to use chart skins to standardize how chart data displays for all users. This can help ensure that all the analysts in your organization see data displayed the same way, which can be important when decisions are made based on data.
For more information, see Chart Skins
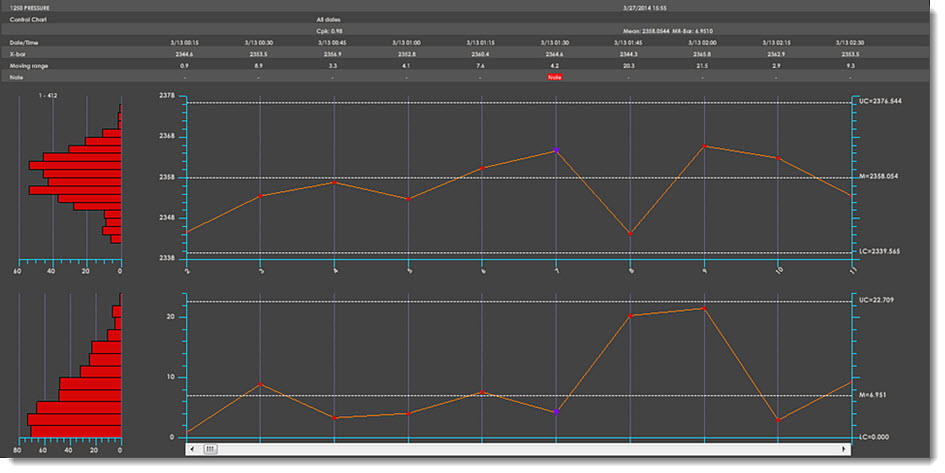
Above is an example of a Control chart with the Techster Chart Skin applied, one of the ready-to-apply chart skin themes now included with GainSeeker. Below is an example of Data Head Chart Skin.
Now you can add an image to the background of a chart. In addition to making your data analysis more visually engaging, it can serve a practical purpose. For example, if your company sends a copy of a chart with shipped product, you might consider adding an image of your company logo to the chart background as shown in the upper-left corner in the chart below. You can also save the background image as a chart skin
For more information and examples, see Adding a background image to a chart
![]()
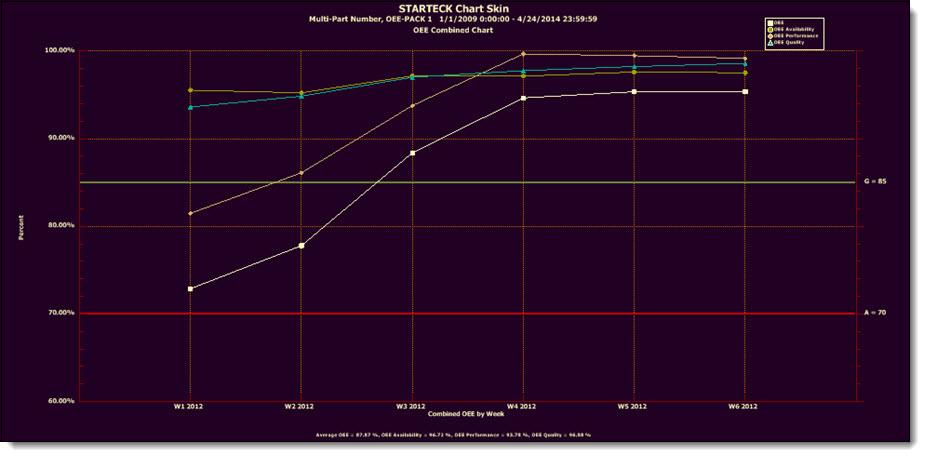
Now you can specify a color for each of the OEE metrics: Availability, Performance, Quality, and overall OEE. The assigned colors carry over to the OEE Combined chart and help you identify each data metric when you save them on a desktop, for example, as shown below. Applies to OEE line- and bar-type charts. See Using colors for OEE Data for more information.
Now you can send all the charts and dashboards saved on a desktop directly to a Microsoft PowerPoint presentation or to Word. You can also select only specific items to send.
You can specify the order in which dashboard controls display on a dashboard window—which ones display in the foreground in the event they overlap. This is called the "Z-order" of objects.
Now you can use the right-click Send Control To menu option to send data for a Dashboard Grid control to Microsoft Excel.
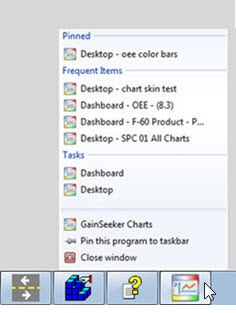
Now you can use the Windows Jump List feature with GainSeeker to gain quick access from your workstation's taskbar to desktops, dashboards, and reports you have recently used. This feature is available for the GainSeeker Charts module (dashboards and desktops) and the Dynamic Reports module.
New parameters to have GainSeeker automatically open a desktop with these retrieval options you set for charts:
Specify DMS part numbers and/or processes, and SPC part numbers for desktop charts
Set a filter for the retrieval
Set a date period for the retrieval
See Open a desktop for more information
New parameters to have GainSeeker automatically open OEE charts.
New MARPOSS_DISCONNECT disconnects all devices. The new MARPOSS_UNLOAD command removes the Marposs software driver from memory. See these topics for more information and information on related commands.
Used in conjunction, commands CHT_OPT_DMS 99, "", CHT_OPT_DASH 99, "", CHT_OPT_SPC 99, "", destroy the chart COM object so it can be recreated the next time a chart is drawn.
New MISC_INFO 13 command returns a string representing the installed GainSeeker version of the DESPC.exe (returns 8.3.1, for example). This knowledge can be used to help you determine whether you want to proceed with certain functions for a workstation.
IF command is capable of performing multiple tests (conditionals) for an IF command. AND and OR can now be used in an If/Then/Else statement.
New DE_OPT 37 parameter disallows operator from automatically advancing to the next cell after selecting a traceability from a list. If disallowed, operators can manually advance to the next cell.
New DE_OPT 38 parameter enables display of a new Enter key button on the SPC Data Entry screen. The button, which can be relabeled from Enter using the Text_Opt 4 command, is located adjacent to and left of the external applications button when both buttons are enabled. A practical use for the Enter key button is to restart a template that is stopped due to an operator clicking on a tab, for example, to view a data table.
New MISC_INFO 12 command returns the current cell of execution in the template.
Updated or new template commands in other recent GainSeeker releases
The DMS Data Entry on_save cms.ini setting is updated to not fail using the default useqry setting (1) in convert.db. However, you must set useqry=0 for this feature to work correctly. Note: This only applies to Microsoft SQL Server.
For more information, see "Cleanup8.exe utility". (Utility removed from GainSeeker 8.6 and later.)
The SQL Utility now allows you to Import and export SQL statements, and have multiple copies of the utility running simultaneously in GainSeeker. See GainSeeker SQL Utility for more information about this utility.
Now you can edit lists for Traceability, Cause, Event, or Action directly from the GainSeeker Lists function. See GainSeeker Lists for more information.
Now you can filter notes by their content and by RTF (real-time failure) flag. For example, you could limit the list of notes to those containing the words "material change." For more information, see Note Manager
GainSeeker LaunchPad is revamped with an updated, but familiar display. A few changes improve Choose button and File menu functionality. LaunchPad's quick-start buttons offer access to GainSeeker modules with a click.
OEE charts in the GainSeeker Charts module
OEE (Overall Equipment Effectiveness) tells you the percentage of time that your planned production time is fully utilized. GainSeeker calculates the overall OEE percentage using the percentages from three submetrics measured in your plant: Availability, Performance, and Quality. An overall OEE percentage of 85% or more is considered World Class Manufacturing. OEE charts are similar to DPU charts in that they use percentages to group data by a time period, such as shift, hour, day, or week.
Use OEE data to:
Learn if you are getting the most from the assets you have.
View plant data by each shift for each day or pick from multiple other time increments or a traceability.
Pinpoint times and shifts when production tends to flourish or falter.
Increase equipment reliability and reduce downtime through planned maintenance instead of reactive repair.
Identify missed opportunities when more first-pass yield could have been produced.
See OEE Charts for more information
GainSeeker Inspections module
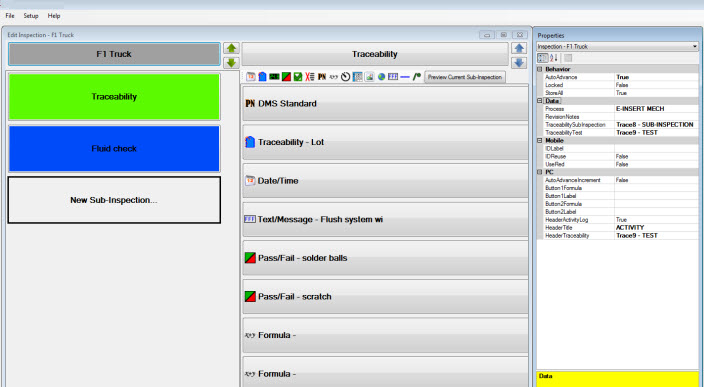
The GainSeeker Inspections module features the Inspection Editor shown below. Use it to create inspections you can have up and running in minutes. No template writing is required, but you can optionally write templates to create advanced inspection enhancements.
No template writing required. Have a new inspection up and running in minutes.
Use it to store defect data and data without defects. Storing both data types produces a record that the inspection was performed. You can still opt to only store data with defects.
Integrates with your existing GainSeeker system just like all other GainSeeker modules. The Inspections module can use any processes, defects, DMS and SPC standards, and traceability fields you have defined in your GainSeeker system. You can always add more for use in your inspection.
Advanced inspection customization options. This feature is not necessary to create comprehensive inspections, but GainSeeker inspections can be further customized to meet your advanced requirements using the Formula feature of the Inspection Editor. This is recommended for use only by Hertzler Systems technical experts or others who are confident working with coding languages.
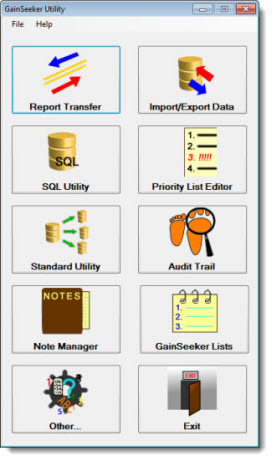
GainSeeker Utility module
The GainSeeker Utility module is a collection of practical functions designed to help you easily maintain your GainSeeker system. The legacy Utility modules are still available in GainSeeker version 8.3 .
Updated or new template commands version 8.3
New TABLE_GET_ITEM and TABLE_SET_ITEM commands read and write to the HSIRPT table.
New MARPOSS_CONNECT, MARPOSS_SCALING, and MARPOSS_ACQUIRE commands provide an interface to the Marposs EasyBox device.
New SAVEROWS -1 command only saves rows that are associated with a valid standard.
New DATAROWSOK -1 command only displays rows that are associated with a valid standard.
New RS232 alternate commands accelerate data acquisition.
Updated RS232_errmsgs Cms.ini value correctly reports error messages. Previously, setting the value to 1 suppressed error messages instead of reporting them as it was intended to do.
Updated DEFECTID command disregards the case of a defect description. For example, it will identify "Broken" and "BROKEN."
New Group DPU or OEE chart data by options
Now you can group data on an OEE or DPU chart by Day/Shift or several other added time increments. Data grouped by Day/Shift displays data for each shift in a 24-hour day.
New DMS cost information option
New DMS cost information setting lets you choose to have GainSeeker use cost information from a traceability column you select. See Use traceability column for cost information setting
Hertzler Systems planning to phase out of some legacy GainSeeker modules
The following modules are legacy GainSeeker modules. They are still available with version 8.3 for alternate use.
The new GainSeeker Utility module can now be used in place of these legacy modules:
Import/Export Manager
Priority List Editor
Audit Trail
GainSeeker Lists
Transfer Utility
SQL Utility
SPC Standard Utility
Note Manager
The GainSeeker Charts and the Dynamic Reports modules can now be used in place of these legacy modules:
DMS Charts and Reports
SPC Charts and Reports
Enterprise Dashboard