The GainSeeker Installation and upgrading instructions for the System Requirements have been changed to reflect this information:
For more information, see Installing or Upgrading GainSeeker.
|
Contents [Hide] |
Combine and apply multiple filters to the same data
Now you can apply multiple filters to the same data using the Combine filters feature. If you usually work with several filter combinations, this helps limit the number of filters you need to create while keeping your list of saved filters short. See Setting the filter
Apply an Improvement Start Date and Start Value directly from a DPU chart
From an open DPU chart, you can quickly apply an improvement start date and start value that you have defined for any process to some retrievals. See Select DPU start date and value
The Button dashboard control: Automatically execute functions using command line parameters
Optionally use command line parameters to have GainSeeker perform automatic functions when the Button dashboard control is clicked. You can choose to run a file, template, or planned or stored session. See Editing the ClickAction property.
Normal Probability Plot chart
The Normal Probability Plot chart helps you quickly recognize potentially non-normal distributions. Data points should plot in a linear pattern that approximates a straight line along the axis of the theoretical normal data distribution. Non-normal situations may be indicated by data trending away from the line.
The data in the following example curves upward from under the line and continues in that trend, suggesting greater-than-normal variance.
View Tables and Paths or Traceability Labels selections for all configurations
The View as Text right-click menu option for a configuration now allows you to view the Tables and Paths or Traceability Labels selections for all your configurations in addition to those selections for the selected configuration. See View Tables and Paths or Traceability Labels options for more information.
Updated SETCELL commands allow you to change SPC Data Entry functions while the template is running. You can change the input mode, change the formula, and change the user message that displays at the top of the tab page.
Updated TRACE_OPT commands allow you to configure a traceability column so the cell value must come from a predefined list and configure a traceability column to require entry of a value.
Now you can replace the "Process" parameter with a list of defects in the DMS_COUNTS command.
New EXCELCOM_SAVEAS command saves an Excel file to a new format. Currently, the only format option is HTML.
Updated TIMER_DELAY command halts the data entry session and waits for the timer to expire before it allows the session to resume. You can allow users to view the timer countdown, pause and resume the timer, cancel or run immediately, and reset the timer.
New CLOSE0 command closes the RS232 input buffer for COM port n.
Updated DE_OPT parameter (DE_OPT 32) turns on and turns off the Ctrl-K function, which allows the Data Entry template user to switch from RS232 mode to keyboard mode without any modifications to the template.
Updated DE_OPT parameter (DE_OPT 34) turns on or turns off the Save Changes dialog box.
Updated MISC_INFO commands (MISC_INFO 10), (MISC_INFO 11) return the number of the current configuration and the name of the current configuration, respectively.
New date_format parameter option of the DATE_PICK command formats the return value according the short date and time format in a workstation's regional options.
New EXCELCOM_SHEET command changes the active sheet (the sheet on top) in a Microsoft Excel file. If you switch to Sheet 2, for example, all changes you write will apply to Sheet 2 until you change to another sheet.
Updated PATH command returns many new options.
Updated CHOOSE3 command allows you to center the dialog box on the data entry screen. If there is no text label on any of the three buttons on the dialog box, the button will not display.
Updated TRACE_MR command indicates the number of the traceability field that should be searched for the specified text.
Hertzler Systems plans to phase out some Legacy GainSeeker modules
The GainSeeker Charts module and the Dynamic Reports module can now be used in place of these modules:
DMS Charts and Reports
SPC Charts and Reports
Enterprise Dashboard
Beginning with GainSeeker version 8.2, these modules are referred to as the LEGACY Charts and Dashboard modules. The LEGACY modules are still available with version 8.2.1 for alternate use.
Visually engaging, interactive—and expanded options for analyzing and reporting data
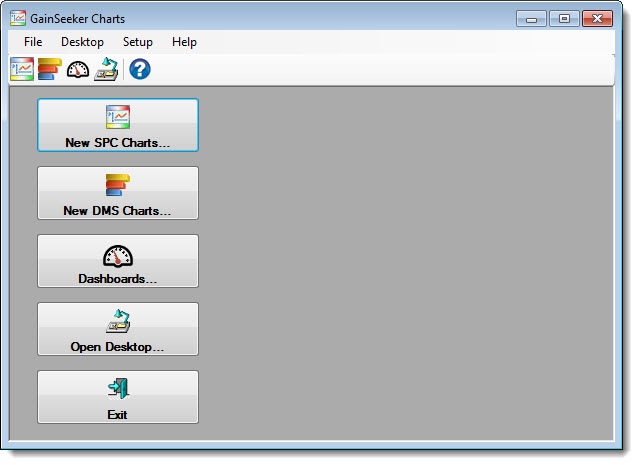
The GainSeeker Charts module partners with the Dynamic Reports module in Version 8.2 to offer even more options for analyzing and reporting data.
The GainSeeker Charts window serves as the backdrop for all your analysis. It offers advanced tools for creating SPC charts, DMS charts, and interactive dashboards—all which can now be stored together as a retrievable Desktop
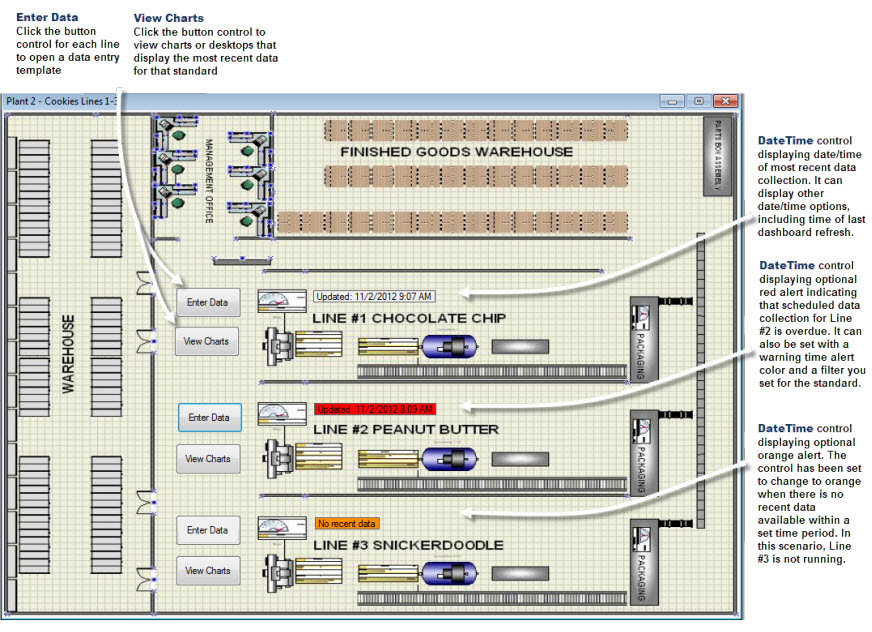
Thirteen new Dashboard Controls offer versatile design and function to dashboards
Adding dashboard controls to the dashboard window
See Shadowing the Pros in Dashboard Design to learn how to design interactive dashboard that perform.
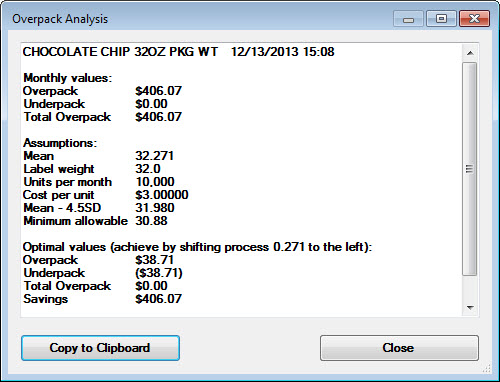
The Overpack Wizard
Primarily used by foods industry companies whose products need to minimally meet the stated package label weight, the Overpack Wizard can be also used for other applications, such as paint coat thickness. A shift in process or reduction in variation could save you a substantial amount of money over time.
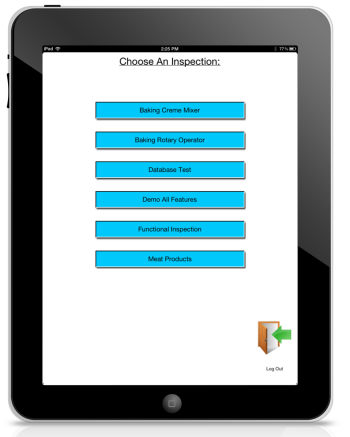
GainSeeker Mobile Device Support for Data Collection
Now you can collect inspection data using mobile devices such as an iPad or iPad Mini tablet. Take photos of defects on the spot, add comments, and more. Contact the Hertzler Sales Department for more information about GainSeeker Mobile Collect.
Import your GainSeeker Versions 8.1 and earlier dashboards to the GainSeeker Charts module
Dashboards from the Enterprise Dashboard module (version 8.1 and earlier) can be easily imported to the GainSeeker Charts module.
Performance Charts
The new Performance chart helps define process capability by grouping data by a traceability value using a Box and Whisker format. This allows for quick visual comparison of data groups by mean and variation.
Data Brushing on charts
Data brushing is a simple technique that allows you to select data points on a chart, then choose from options that allow you to focus only on that data or to exclude it from a retrieval.
Command Line options enable automatic task execution
You can create a shortcut to have GainSeeker automatically open Desktops, Charts, or Dashboards. You can also opt to have GainSeeker then execute tasks for these items, such as printing, exporting, and closing items.
Send charts and data values to Microsoft PowerPoint or Word
Sending an image of a chart to Microsoft® PowerPoint or Word is a quick and simple process. You can also send data values for tables and statistics lists.
Hertzler Systems plans to phase out some Legacy GainSeeker modules
The GainSeeker Charts module and the Dynamic Reports module can now be used in place of these modules:
DMS Charts and Reports
SPC Charts and Reports
Enterprise Dashboard
Beginning with GainSeeker version 8.2, these modules are referred to as the LEGACY Charts and Dashboard modules. The LEGACY modules are still available with version 8.2 for alternate use.
The GainSeeker Online User Guide
Navigate with ease following these guidelines.
You can use the Contents tab (Fig. 1) on the Online User Guide for GainSeeker to locate topics that apply to the module in which you are working.
This is important because the instructions for performing a specific task ("create SPC charts," for example) may differ between the GainSeeker Charts module and the LEGACY Charts and Dashboard modules, even though these modules have many topics in common.
Fig. 1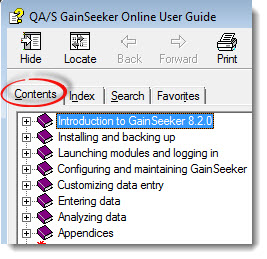
To locate LEGACY modules topics and the NEW GainSeeker Charts module topics:
The NEW GainSeeker Charts module and Dynamic Reports module topics and the LEGACY Charts and Dashboards modules topics are located on the Contents tab as shown in the following diagram (Fig. 2).
Fig. 2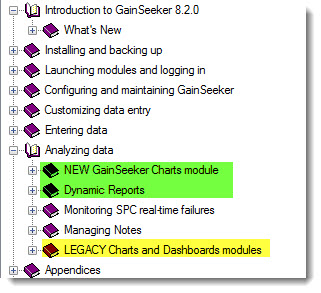
Fig. 3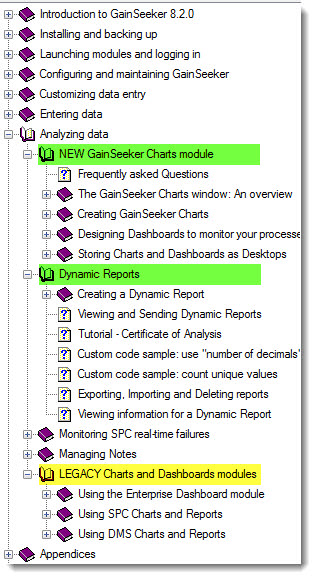
What's new in the Dynamic Reports module
Add charts to a Dynamic report
Use the new Charts tabs on the SPC (or DMS) Report Retrieval Settings dialog boxes to choose the types of charts to generate for a Dynamic report. The charts will draw for each part number you select for the report.
Automatic prompt for change in part number, date range, or filter before viewing reports
You can opt to have GainSeeker prompt you for changes in part number, date range, and/or filter before you view saved reports.
AutoRefresh Report property implemented
The AutoRefresh property is now implemented. This allows refreshing data for a report that is open in view mode.
Other Improvements
Tools for template version control
Tools for version control were added to the SPC Designer module that allow you to see what changes were made between versions of a template. A Best Practice checklist was also added for version control.
New Template commands
ARRAY_OPT command clears all values in the given MySArr array or MyNArr array.
LIST_Q array command now displays the contents of a MySArr array from which you can select.
Now you can group DPU chart data by the hour, day, week, month, or quarter
New "Percent (%) Above Range Gate" and "Count Above Range Gate" included in new statistics
GainSeeker can now perform calculations for the following statistics:
CountBelowRangeGate
CountInsideRangeGate
CountOutsideRangeGate
BelowRangeGatePct
BelowUpperRangeGatePct
AboveLowerRangeGatePct
InsideRangeGatePct
OutsideRangeGatePct
See SPC Statistics available for more information
Display control limits on DMS Yield charts
Now you can opt to display control limit lines on DMS yield charts in the GainSeeker Charts module.