
If you are updating a workstation or server where GainSeeker is already installed, use a mapped network drive, and have problems accessing mapped network drives during the client installation, a new Client update with mapped network drive can perform a local version of the client update that does not require network access.
When a dashboard includes a Python Script Designer control, GainSeeker will automatically wait up to 10 seconds for that control to finish executing the Python script before publishing or e-mailing that dashboard. Now you can change the length of this timeout period for any workstation. For more information, see Timeout period for Python Script Designer control.
Debugging Python scripts for an Inspection now pauses the debugger each time an Action-based script is triggered. This makes it easier to insert breakpoints when debugging an Inspection that contains an Action-based script.
You can now use GainSeeker's powerful visualization tools like Dashboards and Charts to display quality, performance, scheduling, or other business data that is stored in other files, databases, and other systems outside of GainSeeker - all without storing that data in GainSeeker! This allows you maintain a single system of record by pulling the data directly from your other systems, avoiding the usual headaches associated with having to store the same data in two places.
New Python scripting commands make this possible. For details, see Retrievals for Dashboard Controls and Charting External Data.
The Toolbar in the GainSeeker Charts module has been updated to make charting easier:
Some of the most commonly-used functions for an open chart or dashboard window have been added, making it much more intuitive to find and use these functions.
Larger buttons make it easier to use a touchscreen.
If you have ever experienced the frustration of editing multiple records - one at a time - to correct the same data entry error, or perhaps to document Special Cause Variation spanning multiple quality checks, then this new feature was designed with you in mind.
When viewing an SPC Data Table or DMS Data Table, you can now apply changes to multiple data records at once. This can include:
changing a traceability value
changing corrective action information - Event, Cause (SPC only), or Action Taken (SPC only)
When you change one of these values, you can also append new information to the Note for these records.
For details, see Editing Multiple Data Records.
In previous versions, a DPU chart could divide data into groups based on a single category - for example, a time period (like Month) or a traceability field (like Department).
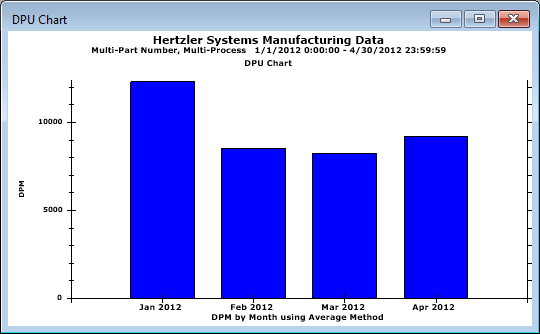
Starting with version 8.8, you can now sub-divide those groups by a second category. This new level of analysis can provide critical insights about which processes are performing well or need the most improvement:
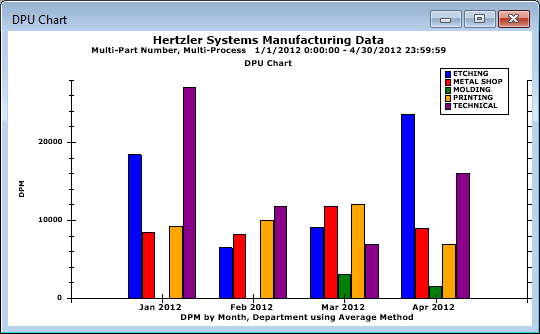
For details, see Group data for DPU chart.
The GainSeeker Charts module now contains a new type of SPC chart - the Monitor Table.
The Monitor Table displays individual SPC data records, with their real-time failure status, for multiple standards.
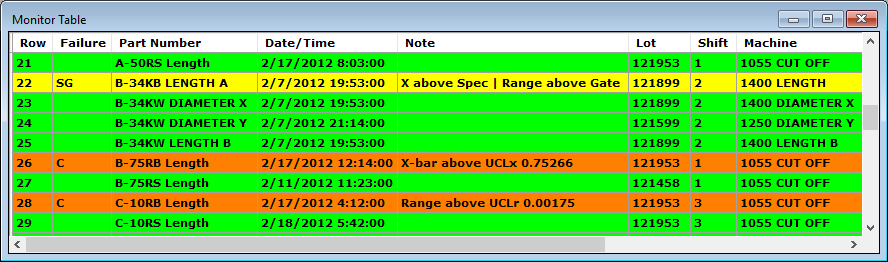
There are three ways to view the Monitor Table:
Display only failure records - Useful for seeing what has failed recently and for following up on failure incidents.
Display the last record for each standard - Useful for viewing the current status of any standards, based on their most recent data.
Display only records without failures - Makes it easy to see which standards are currently running without failures, based on their most recent data.
The Monitor Table takes the place of the legacy SPC Database Monitor module.
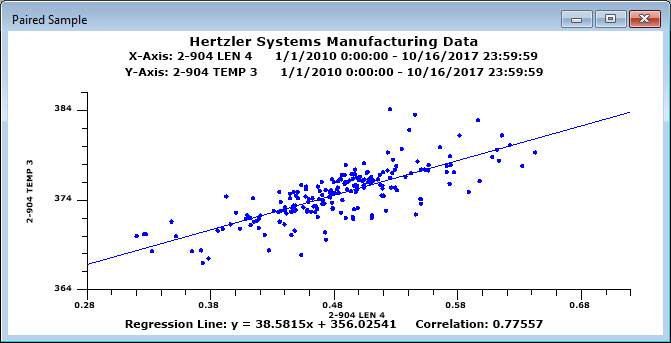
Paired Sample Analysis has now been added to the GainSeeker Charts module.
This lets you compare any two SPC datasets and plot them against each other, in order to find a relationship between the two.
You can now send information to MINITAB version 18 from the GainSeeker Charts module and from the PC Collect module. For more information, see Using MINITAB with GainSeeker.
You can now maintain separate tables of Python scripts for different configurations. Previously, all Python scripts were shared across all configurations.
One master script table, HSISCRIPTS, stores the Custom Statistics from your System-wide settings. This table continues to be shared across all configurations.
When configuring Tables and File Paths, you can now set the table name for Python Scripts. The table you specify will store Python scripts for dashboards, PC Collect data entry, and scripted External Data.
In the GainSeeker Charts, Dynamic Reports, and PC Collect modules, the retrieval option Calculate Defects per opportunities instead of total Units no longer affects the calculation of the DMS statistics Yield, % NCU, and % Good Units.
The GainSeeker Charts, PC Collect, and GainSeeker Inspections modules can now display modern web pages that dynamically change based on screen size (computer, tablet, or phone).
When configuring an SPC Event, Cause, or Action Taken, all GainSeeker modules now require both a Short Description and a Long Description. This prevents some known errors from occurring when charting or editing data that had a blank Long Description.
When GainSeeker cannot connect to your database using the Database Connection (set during GainSeeker installation or modified in the System Administration module), it now displays a message about the connection error to assist with troubleshooting.
When editing a data record or a standard, the Audit Trail tab now loads faster.
When editing the defects for a process, a new sort order button makes it easy to sort the process defects alphabetically. Additionally, the label on the master list of defects has changed from All defects to Available defects, which is a better description of this list.
The Inspection Editor toolbar and right-click menu have been updated as follows:
A new Save & Publish toolbar button saves changes to the inspection, publishes the inspection, and leaves the Inspection Editor open.
A new Run PC toolbar button and right-click menu option will run the inspection as it would appear in the PC Collect module. You can use this to run an inspection - or a newer version of an inspection - before you publish it for data entry.
A new Debug (PC) option on the right-click menu will turn on the Python debugger and run the inspection as it would appear in the PC Collect module. You can use this to debug an inspection - or a newer version of an inspection - before you publish it for data entry.
The Mobile Preview button has been removed from the toolbar and added to the right-click menu.
Debugging Python scripts for an Inspection no longer stops each time a new script is triggered. Instead, you can now set breakpoints for multiple scripts before starting the debugger. This streamlines debugging, especially when an inspection contains OnChange scripts.
A new Label property for the Traceability test lets you customize the label displayed for that test in PC Collect. In previous versions, this could only be achieved via Python code.
A new option for the Traceability test - Text Entry - allows the inspector to input a value that is not stored with the submitted data but can be read by Python code. This option applies only to inspection data entry in PC Collect.
A new option for the Formula test - Cancel - will only execute the formula if the sub-inspection is cancelled. When such a formula is triggered, the testid variable will be set to "[CANCEL]". This option applies only to Python formulas in PC Collect.
A new AutoStart property for the Timer test lets you automatically start the timer when the sub-inspection opens in PC Collect. The Timer test now also includes a TestID property for use in PC Collect.
A new CancelButtonLabel property for the sub-inspection lets you rename the Cancel button and suppress its warning message about unsaved data being lost. This property applies only to inspection data entry in PC Collect.
A larger font size is now used on the grid for Inspection properties, making it easier to read and change these properties when setting up inspections.
For a Numeric Input test, in the CheckFailureResponse property, a semicolon that is used to separate e-mail addresses will now be automatically corrected to be a comma.
Documentation for the Image test on Mobile devices has been updated to note that only one copy of an image filename will be downloaded to each Mobile device.
A Date/Time test now formats the date and time according to the Windows settings for Short Date and Short Time.
When a Traceability test is configured to restrict the inspector to choose from a pre-defined list of values, it will now trigger an OnChange Formula test as soon as the inspector chooses a value from the list. In previous versions, the Traceability test would not trigger the OnChange formula until the focus was lost.
When displaying Defect buttons for a Defect List test, GainSeeker will now automatically resize the font as needed to show longer defect names.
When displaying the Label for a Defect List test, Checkbox test, Numeric Input test, Pass/Fail/NA test, and Timer test, GainSeeker will now automatically resize the font as needed to show much longer labels.
When displaying subgroup real-time failures for a Numeric Inspection test, GainSeeker will now automatically resize the font as needed to show much longer messages - for example, when the subgroup fails multiple real-time failure checks.
The sub-inspection Note and individual Note windows now display a scrollbar if the note text does not fit in the window.
In a Numeric Input test, when a measurement falls outside the reasonable limits, a message will be displayed above the measurement values. Previously, the inspector could not see the message about the reasonable limit violation unless they hovered their mouse over the data field for that measurement.
When a Numeric Input test is configured with a Device Profile for RS-232 input, any data cell for that Numeric Input test will automatically trigger that Device Profile as soon as the focus enters that cell.
When a Numeric Input test is configured with a Device Profile that writes a string to the device or clears the buffer before reading data, it will no longer force the user to acknowledge a message (by clicking it) before starting data entry from the device.
The Picture button and Video button for a sub-inspection have been replaced by a new Capture button which combines picture and video functions based on existing sub-inspection properties for PictureMode and VideoMode. Video attachments can now be emailed and/or stored based on the PictureStorage and PictureEmailAddress properties for the sub-inspection.
You can now launch the GainSeeker Inspections module from the File menu in the PC Collect module.
Unlike previous versions of GainSeeker, cancelling a sub-inspection does not trigger execution of any OnChange formulas in the sub-inspection.
To use PC Collect with a touchscreen display, you may need to widen the scrollbars. The Online User Guide has been updated with instructions that an IT staff person can use to widen the scrollbars on a data entry workstation.
In the GainSeeker Inspections module, a Debug check box has been added below the Run button on the list of Inspections and on the list of Planned Inspections. This allows you to debug inspection scripts from within the GainSeeker Inspections module, and it replaces the debug command line parameter that was previously available for the PC Collect module.
In the GainSeeker Inspections module, while editing an inspection in the Inspection Editor, you can now right-click and choose Debug (PC) to turn on the Python debugger and run the inspection as it would appear in the PC Collect module. You can use this to debug an inspection - or a newer version of an inspection - before you publish it for data entry.
When editing an Action-based Python Script, you can now right-click any Action to edit its Description.
The new inspect.process command returns the Process property for the inspection.
The new inspect.cursubi.timer(idx).value command gets the current value of a Timer test.
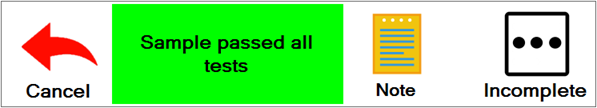
Two new Python commands - inspect.messagearea.text and inspect.messagearea.color - allow you to display text on a colored background at the bottom of the sub-inspection.
When debugging a Python script, any values that you print to console are displayed in the upper right panel. You can now edit or delete text in this panel, or press Ctrl+Home or Ctrl+End to jump to the start or end of the text in this panel. This is makes it easier to debug a Python script that prints many values to the console.
The new inspect.cursubi.ni(idx).labelabovecell command for a Numeric Input test can turn on the display of cell labels (Data 1, Data 2, etc.) above every cell.
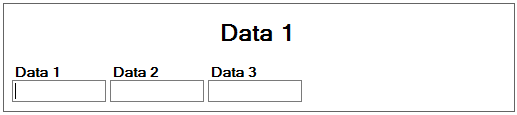
The new inspect.cursubi.ni(idx).celllabels command for a Numeric Input test lets you replace the default cell labels "Data 1", "Data2", etc., with your own custom labels (such as "Cavity 1", "Cavity 2", etc.).
Previously, the  (Used By)
button would check for inspections or dashboards that run
the selected script. Now it also checks for other scripts that
use misc.executescript("scriptname")
or misc.executescript('scriptname')
to run the selected script.
(Used By)
button would check for inspections or dashboards that run
the selected script. Now it also checks for other scripts that
use misc.executescript("scriptname")
or misc.executescript('scriptname')
to run the selected script.
New file.xls commands for working with Excel files allow you to add a picture, set the column width, set fonts, and set borders.
The Online User Guide now provides more details and suggestions for Formatting Excel files.
The Online User Guide now provides more details and suggestions for Checking for script usage and Controlling revisions.
The Online User Guide has been updated with details for using file.getpath(13) on a Windows Terminal Server farm where users are configured with a Home directory.
When you use the GS Console module to run a standalone Python script, you can now use the Python print command to display information.
When you use the GS Console module to run a standalone Python script, application errors are now written to the Windows Event log.
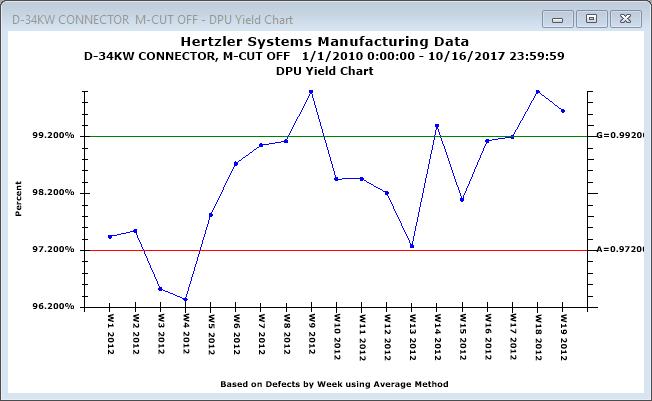
You can now set a Goal line and an Acceptable line to display on DPU Yield charts and other reports. These are set separately for each DMS standard.
You can now use SnapToGrid when designing dashboards. When enabled, this functionality automatically adjusts the size and location of dashboard controls so that their edges line up with an underlying grid.
A larger font size is now used on the grids for Dashboard properties, Dashboard Grid columns, and Marquee segments. This makes it easier to read and change these items when setting up dashboards.
When displaying a slideshow of charts and dashboards, the dashboard controls for Big Data Analytics and Python Designer now display correctly on the slideshow. When displaying a Python Designer dashboard control in a slideshow, GainSeeker will delay up to 10 seconds for the Python script to finish executing.
When a Pareto chart is displayed, you can easily view a DPU chart for any Pareto bar.
Data is now retrieved asynchronously for many dashboard controls. This means that the dashboard will load and immediately become responsive, and the individual controls will fill in as they complete.
Beginning with GainSeeker version 8.8, you can now use a Static Text dashboard control to create a horizontal or vertical line on your dashboard.
On a Dashboard Grid where traceability values are used to
define
the rows but process specifications have not been created
for those traceability values, GainSeeker now uses the number
of decimal places that is set as the default for new SPC standards
in the current configuration. This also applies to other windows
such as Data Tables that were generated from such rows.
In previous versions, the default number of decimal places for
this type of row was hard-coded to 1 for the Data Grid and 0 for
other windows generated from this type of row (such as Data Tables).
When you launch the GainSeeker Charts module, GainSeeker will find any SPC Event, Cause, or Action Taken where the Long Description is blank (which previous versions of GainSeeker allowed you to configure) and will automatically insert a value in these blank fields. This prevents some known errors from occurring when charting or editing data. Depending on your Audit Trail settings, GainSeeker may display a message after these values have been updated. All GainSeeker modules now require both a Short Description and a Long Description when you configure an SPC Event, Cause, or Action Taken.
When using GainSeeker on an Oracle database and setting the Table names for a configuration, you can now use dot notation to specify both schema name and table name. This allows you to point GainSeeker to tables that were created in Oracle user schemas that are different from the Oracle user being used to log in to GainSeeker.
When creating a custom statistic, the built-in tools for testing and debugging your code use a sample data set to calculate your custom statistic. Instructions are now available for debugging and editing your custom statistic using your own real-world data.
For most types of GainSeeker items in the Report Transfer Utility, you can now select multiple items to export or import. Previously, you could only export or import one item at a time.
Importing and Exporting data now handles large files faster and more efficiently. This is done by streaming files instead of loading files.
Deleting data can now delete data when your GainSeeker table names specify a database View. Note Sync cannot be run on a database View, and it now displays a message if you try to do so.
A new topic - Finding Information in the Online User Guide - has been added.
Additional information on selecting long lists of SPC standards for Summary Charts has been added.