What is Overall Equipment Effectiveness (OEE)?
Overall Equipment Effectiveness (OEE) is a tool that helps manufacturing leaders answer the question: “Am I making money?”
The ultimate answer to that question (Am I making money?) comes too late—at the end of the month, quarter or year, when the accountant delivers the Profit & Loss statement. The Profit & Loss statement is, at best, a snapshot in time. And worse, it is seen through a rearview mirror.
Manufacturing leaders need tools to evaluate whether they are on track to meet their profitability goals. When things aren’t on track, they need real-time diagnostic tools that enable them to drill down to the root cause, so they can make necessary changes.
An OEE measuring system gives leaders up-to-the minute status about three critical inputs to manufacturing profitability:
- Availability: Are my machines (assets) running?
- Performance: Am I meeting production goals?
- Quality: Is my quality OK?
By tracking these three metrics (and their relationship) over time, leaders can build correlation between OEE and financial performance.

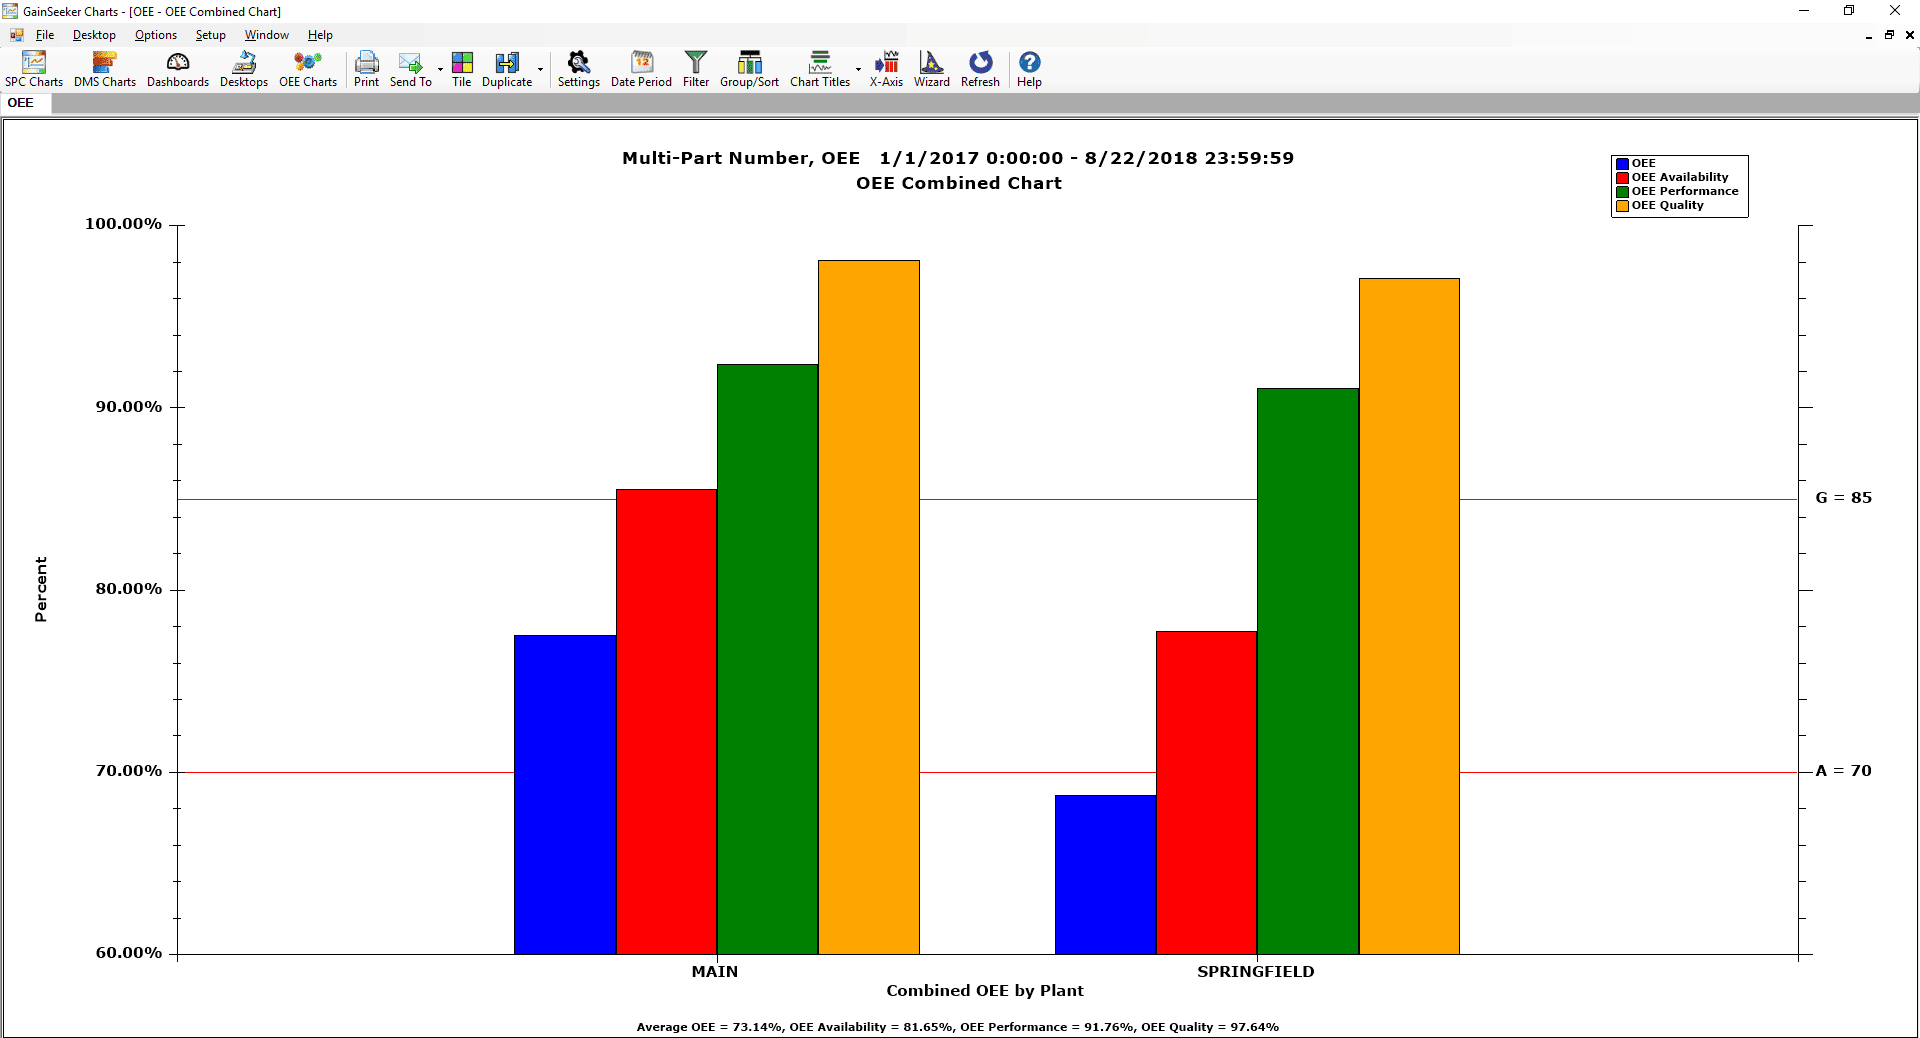
Overall Equipment Effectiveness (OEE) Combined Chart displays OEE, Availability, Performance and Quality on one chart. In this example we compare OEE across two manufacturing plants in the supply chain.
OEE Formulas
OEE is made up of three component measurements: Availability, Performance and Quality. These are multiplied together to calculate the OEE value.
| Metric: | Availability (Up Time) |
| Definition: | The percentage of the scheduled time that a machine is producing parts (“Available”). |
| Formula: | Availability = Available time / Scheduled Time |
| World Class: | 90% |
| Metric: | Performance |
| Definition: | The speed that the equipment is running at, relative to its target speed (the “Ideal Cycle Time” needed to produce one part). |
| Formula: | Performance = (Total parts produced * Ideal Cycle Time) / Available time |
| World Class: | 95% |
| Metric: | Quality |
| Definition A: | The ratio of good units compared to all the units that were started. Sometimes called First Pass Yield. |
| Formula A: | Quality = Good parts produced / Total parts produced |
| Definition B: | The ratio of time needed to produce good parts compared to time needed to produce all parts. |
| Formula B: | Quality = Time used to produce Good parts / Time used to produce Total parts |
| World Class: | 99.9% |
Each of these three component measures is presented as a ratio, so each is multiplied by 100 and reported as a percentage.
Once all three component measurements are in place, a combined Overall Equipment Effectiveness metric may be calculated:
| Metric: | Overall Equipment Effectiveness |
| Definition: | Result of multiplying all three ratios together. |
| Formula: | OEE = Availability * Performance * Quality |
| World Class: | 85% |
| Formula B: | Quality = Time used to produce Good parts / Time used to produce Total parts |
| World Class: | 99.9% |
See also OEE Defined – Quality, Performance, Availability.

Real-time Overall Equipment Effectiveness (OEE) Dashboard showing comparative performance of two assets.
OEE Benefits
OEE can help manufacturing leaders:
- Reduce downtime costs
- Reduce repair costs
- Increase equipment efficiency
- Increase labor efficiency
- Reduce quality costs
- Increase personnel productivity
- Increase production capacity
OEE is a scalable metric.
OEE can be applied to a single asset (machine or piece of equipment), a department, or an entire manufacturing floor. In an ideal world, the metrics are collected across all assets, all lines, and all plants in a manufacturing supply chain. This makes it possible to compare OEE KPIs across the supply chain, and over time.
Rolling up OEE solutions across multiple assets makes it possible to prioritize improvement efforts across the organization. Tracking improvement over time ensures improvements are successfully maintained.
OEE is a powerful diagnostic tool.
OEE can help address problems early to maximize financial performance. This can be most effective when data is organized for easy drill down analysis. OEE should help answer questions such as:
- How are my assets performing over time?
- Which assets are under-performing?
- Why are they under-performing?
See also these case studies about Real-time OEE Dashboards and GainSeeker OPC solution boosts OEE.
Potential OEE Pitfalls
OEE isn’t magic. It can’t solve everything.
OEE doesn’t say anything explicitly about profitability and is not a direct measure of customer satisfaction. For these reasons, best practice is to use OEE as part of a larger evaluation of Key Process Indicators (KPIs). This often requires evaluating KPIs across silos of data. Optimizing one metric can often cause sub-optimum performance for other metrics. To avoid this, work for a balance of KPIs that are unique to the situation.
The method by which OEE is calculated can be a potential pitfall. Multiplying three ratios together to get a fourth value may hide important signals. For example, a shift in one of the component values may completely mask a shift in the opposite direction by another component value.
It can also be challenging to compare OEE across assets and across facilities. Each asset has its own baseline for OEE performance losses or gains. If you fail to consider that variation in your rolled up numbers, you may compare dissimilar values.
For additional discussion, see this post: Beyond the hype and the critique – making OEE more effective
OEE in GainSeeker Suite
GainSeeker® Suite turns manufacturing data into useful OEE analytics tools.
Use OEE charts to:
- Pinpoint times and shifts when production tends to flourish or falter.
- Increase equipment efficiency and reliability by reducing downtime through planned maintenance, not reactive equipment repair.
- Identify missed opportunities when more first-pass yield could have been produced.
- Increase profitability by reducing scrap, variation, rework and other costly waste.
- Get the most out of existing assets. Delay or avoid costly capital projects.
This analysis can be applied to a single asset, a production line, a manufacturing plant or the entire supply chain.
See also the GainSeeker online manual for OEE Charts.

OEE Data Entry form for Downtime reasons. OEE data can come from automated equipment, or from operators, or a combination of human and machine sources.

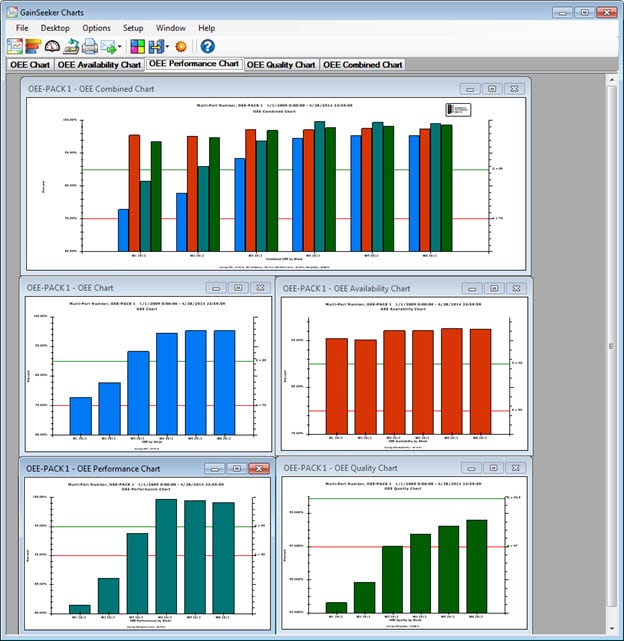
Overall Equipment Effectiveness (OEE) Combined Chart in the top window can be expanded out to all of the component metrics in their own windows.
OEE Chart Types
Display these OEE chart types as line or bar charts:
- Performance chart
- Availability chart
- Quality chart
- OEE Overall chart
- OEE Combined chart
Display individual charts for each component metric, or display all charts together on a desktop. Display the OEE metric and all three component metrics on an OEE Combined chart. Drill down to target factors and slot them for improvement.
Flexible two-level grouping aids understanding of the underlying data.
Get practical guidance for OEE implementation.
For guidance on implementing OEE in GainSeeker Suite, check out the OEE Kit in the GainSeeker Platform Library. The library is a treasure trove of insights compiled from years of experience helping other clients maximize the value of manufacturing data.
The OEE Kit includes useful information on setting up data collection, structuring data storage for maximum value, and using analytic tools to predict, diagnose, and prevent production problems. If you’re a GainSeeker Suite user, you’ll be able to download an installable data set with data structures, inspections, desktops, dashboards. And anyone can take watch the instructional videos.
If you’re not yet a GainSeeker Suite user, contact us today about a free demo.

