The DMS Chart Options window lets you configure charts to display on the current sub-inspection. For information on opening this window, see Setting charts to display in inspections.
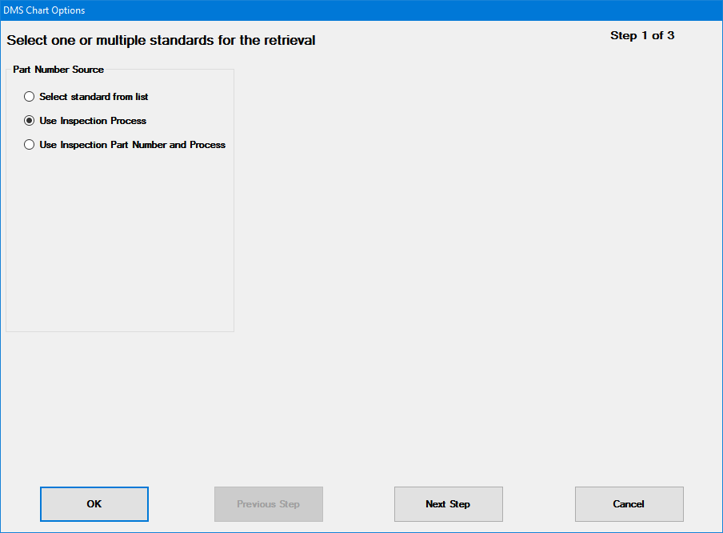
If you want this sub-inspection to chart multiple standards with the same chart types and chart settings (date period, filter, statistical settings, etc.), you can use this step to select all those standards at once – beginning with the Part Number Source:
Select standard from list: Use this option to choose specific standard(s) or process(es) – regardless of any DMS Standard tests in the inspection, and regardless of the Process property of the inspection. For more information, see Selecting Part Numbers or Processes.
Use Inspection Process: Use this option to select the Process specified in the Process property of the inspection.
Use Inspection Part Number and Process: Use this option to select the standard specified in the current DMS Standard test for this sub-inspection.
When finished selecting standards, click Next Step.
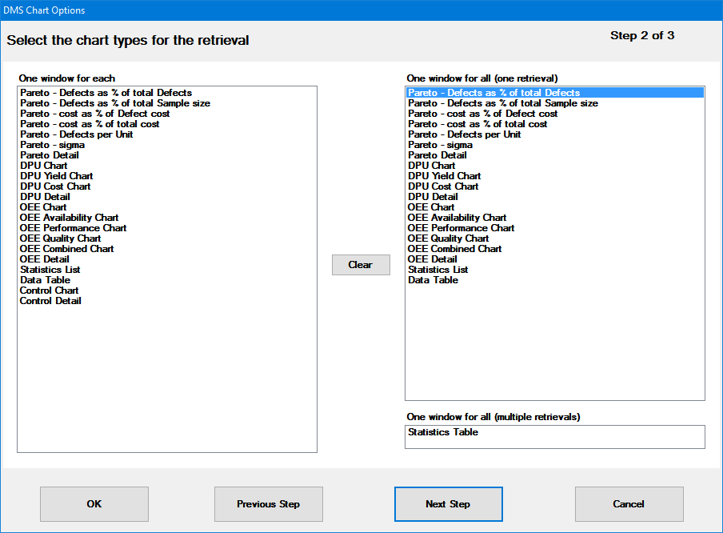
Select the DMS chart types you want to display, and then click Next Step.
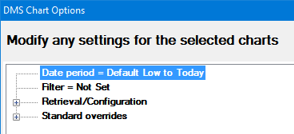
Choose retrieval and statistical settings for the standards and charts you have selected. When finished, click Save and Close.
 Tip: If desired, you can configure the charts with a special filter for data that matches traceability values in this inspection:
In some cases, you may wish to filter the chart for a traceability value that was entered in this inspection – by a Traceability test, Planned Inspection, or Formula test (using inspect.cursubi.trace(idx).value or inspect.settracevalue Python commands).
For example, you might wish to filter for:
a Lot number that the user enters during data entry
a Machine ID that you preset with a Planned Inspection or Formula test
To filter for such a traceability value – which may vary from one data entry session to the next – you must create a saved filter that looks for a blank value in that traceability field, such as this example which filters for the current Cavity number:
Best practice: For this type of traceability filter, best practice is to set this traceability value before launching the sub-inspection that filters charts for that value. This is most easily accomplished by:
requiring the user to Submit the traceability value in a Traceability test on a previous sub-inspection
removing this traceability field from the inspection and using a Planned Inspection to set the traceability value
removing this traceability field from the inspection and using a Formula test to set the traceability value with the Python command inspect.settracevalue. (You can actually execute this Formula on the same sub-inspection as the filtered charts by setting the FormulaMode property to Pre.)
The reason for this recommended practice is that the filter can only access a traceability value after that value has been submitted.
If the traceability value is not set before the sub-inspection with the filter is launched, the charts will be filtered for a blank value in this traceability field until the sub-inspection is submitted with the new traceability value.
When you use the ChartOptionsDMS property of a sub-inspection to set up charts, the timing for creating and updating those charts depends on how the standard or process for those charts is defined.
Note: When the inspector submits the sub-inspection data, all charts open in the right side panel refresh for that sub-inspection. If you have multiple charts or charts containing a lot of data open in the panel, this could prove time consuming.
When standards or processes are selected using one of these methods, the corresponding chart will be created immediately when the sub-inspection opens:
When setting the sub-inspection property ChartOptionsDMS, the Part Number Source is set to Select standard from list
When setting the sub-inspection property ChartOptionsDMS, the Part Number Source is set to Use Inspection Process, and one of the following criteria is met:
The Inspection has the Process property set to a particular process
A Planned Inspection is used to select a different process for the Inspection
When setting the sub-inspection property ChartOptionsDMS, the Part Number Source is set to Use Inspection Part Number and Process, and one of the following criteria is met:
This sub-inspection does not contain a DMS Standard test, because the DMS Standard is set by a previous sub-inspection
This sub-inspection contains a DMS Standard test with the DMSStandard property set to a particular standard
Please note: If the DMSStandard property contains a value that does not match an existing DMS standard, the inspection will still generate a chart for that "value".
This sub-inspection contains a DMS Standard test, and a Planned Inspection is used to select a different DMS standard for this sub-inspection
This sub-inspection contains a DMS Standard test, and it also contains a Formula test with the FormulaMode property set to Pre and the PythonScript property set to a script that uses the inspect.cursubi.dmspart(idx).partnumber command to set a different standard
When the user submits or re-opens the sub-inspection, these charts will be updated to include the most recently-entered data.
When all of the following criteria are met, the chart for a standard will be created immediately after the data entry user selects the standard:
When setting the sub-inspection property ChartOptionsDMS, the Part Number Source is set to Use Inspection Part Number and Process
This sub-inspection contains a DMS Standard test with the DMSStandard property left blank
If the user later selects a different standard for the same DMS Standard test, a new chart will be added for the new standard without removing the chart for the previous standard.
When the user submits or re-opens the sub-inspection, these charts will be updated to include the most recently-entered data.
Any of the following methods will close all charts that are currently open in an inspection:
To close all charts when a sub-inspection opens, set the sub-inspection property ClearSidePanel to True
To close all charts when a Python script finishes running, add the Python command inspect.cursubi.clearsidepanel = True to your script
Close the inspection
Please note: Closing a sub-inspection does not close the charts that are currently open.