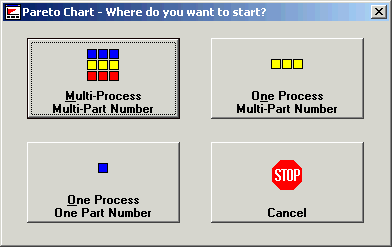
The Pareto Chart Builder draws Pareto, bar and pie charts. When you select the Pareto button on the toolbar or Pareto from the File menu, you will see the Where do you want to start? screen. Use this screen to decide how much data you want to retrieve. Press the Finish button at any time to see the chart. If the builder needs more information, it will tell you.
The Where do you want to start? screen is the key to your analysis.
The choice you make at this screen determines the breadth of the data you will retrieve. The screen gives you three levels to choose from.
Multi-Process, Multi-Part Number
One Process, Multi-Part Number
One Process, One Part Number
The initial screen for the Pareto Chart Builder gives you a choice of three levels. Where you begin determines the scope of the data you will retrieve.

The choice of how much data you want to analyze depends on what you want to learn.
The goal of any analysis is to identify where your greatest opportunity for improvement is. However, you can reach your goal in different ways.
|
Your situation |
Option |
|
You want to see the big picture -- data from the entire plant or business. You want to see where the most opportunity for improvement is. |
Multi-Process, |
|
You have identified the process where you have the most opportunity for improvement. You want to examine one process. |
One Process, |
|
You are ready to zero in on one process. You have identified which process offers you the greatest opportunity for improvement. |
One Process, |
More:
Step 1 in creating a Pareto chart: Selecting the Process on the Pareto Chart Builder
Building a Pareto chart: Selecting the Part Number
Step 2 in creating a Pareto chart: Selecting the date range for retrieval
Step 3 in creating a Pareto chart: Selecting the chart style
Building a Pareto chart: Selecting the "Sort By"
Step 4 in building a Pareto chart: Selecting specific defects, filters and statistics