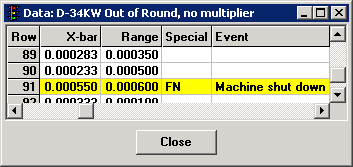
Instructions for displaying the data are slightly different for each type of dashboard:
|
Dashboard type: |
Instructions for viewing data: |
|
Real-time failures |
1. Right-click on the cell for which to view data. 2. On the right-click menu, click View All Data. |
|
KPI gages |
1. Right-click on the Dial gage, Bar gage or Dynamic text item for which to view data. 2. On the right-click menu, click View Data. |
|
Statistical Filter |
1. Right-click anywhere on the row for which to view data. 2. On the right-click menu, click View Data. |
Understanding the "Special" column
The Special column on the data table may display special codes for some data records. For information on what these codes mean, see Special column in the Data Table.
Colors on the SPC data table
For SPC data, data records with real-time failures are displayed according to the color preferences defined for this configuration.

Right-click menu options
You can right-click on the data table for additional options. Some options are available only for SPC data or for DMS data.
Fonts and Colors - Allows you to set fonts and colors for the data table. For more information, see Changing Fonts and Colors on Tables and Lists.
Columns - Allows you to choose which columns are displayed on the data table, and in what order. For more information, see Selecting Display Columns.
Edit Note - Allows you to view and edit the note and corrective action information for this data record. For more information, see Editing the SPC note or Editing the DMS note.
Edit Data - Allows you to edit the date/time stamp, traceability and data values for this data record. For more information, see Editing SPC data or Editing DMS data.
Edit Standard - Allows you to view and modify settings for the current standard. This menu option is only available for SPC data. For more information on the settings for a standard, see Creating and editing standards.
Delete and Delete Range - Allows you to delete this data record or multiple data records displayed on this data table. For more information, see Delete and Delete Range.
Expand Table and Collapse Table - Allows you to hide or display the individual defect counts. To hide the defect counts, click Collapse Table. To display the defect counts again, click Expand Table. These menu options are only available for DMS data.
Send To - Allows you to send data to another program or file. For more information, see Send To options for a Data Table.
Chart - Allows you to chart the data on the data table. For more information, see Charting data.