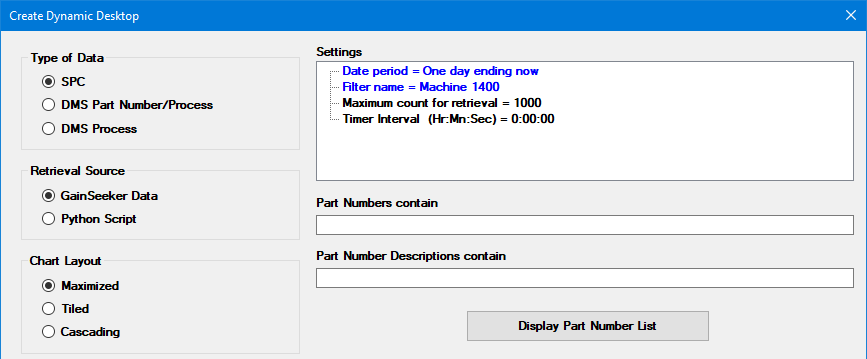
Dynamic Desktops provide a new way to draw charts for whatever is currently running.
For example, the picture below creates a desktop for whatever SPC standards have been running on Machine 1400 in the last 24 hours.
This is much simpler than previous methods of creating a separate desktop for each product and all its features, or opening a generic desktop while manually selecting different standards.
You can also use Dynamic Desktops to chart the data for DMS standards or processes, or use Python scripts to chart data that is not even stored in GainSeeker.
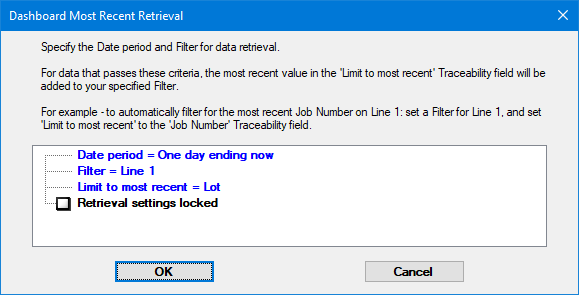
Two new types of dashboard retrievals - SPC data (most recent) and DMS data (most recent) - let your dashboard find the most recent part number or traceability value that is running and show that on the dashboard control.
For example, this is a DMS data (most recent) retrieval for the most recent Lot number that was entered on Line 1 during the past 24 hours.
New chart settings for Real-time failure border make it easy to visualize the most critical real-time failure that occurred in the latest data being charted.
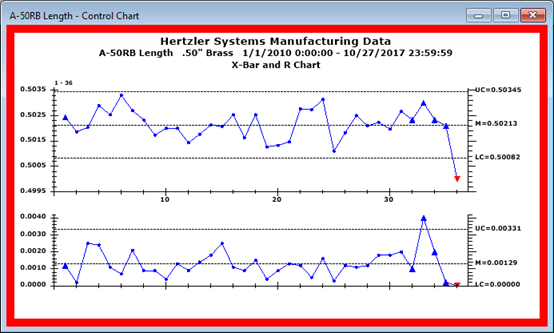
These colored borders can be added in the GainSeeker Charts module - and because they can be saved in chart skins, they can also be applied to Inspection charts for data entry!
The new Paired Sample Grid dashboard control can look for relationships among multiple SPC datasets.
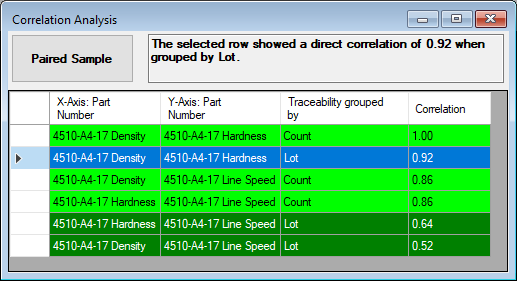
While GainSeeker's Paired Sample chart analyzes the relationship between two specific SPC datasets with one traceability grouping, this dashboard control retrieves all SPC datasets that meet the criteria you specify and uses all count groupings and traceability groupings you specify to analyze all potential combinations and report those pairs with the highest probability of correlation.
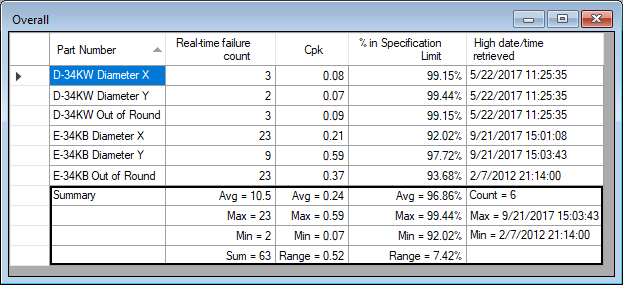
A Dashboard Grid control can now display Summary information - Sum, Average, Count, Maximum, Minimum, and/or Range - that is calculated from the values in each column.
A new Summary property for each column allows you to select which of these values to display.
When selecting the User or group name to log in to GainSeeker, you can begin typing to move to the first name that matches the characters you have typed.
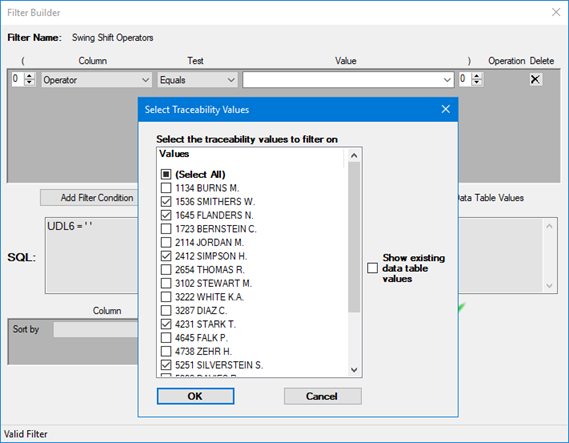
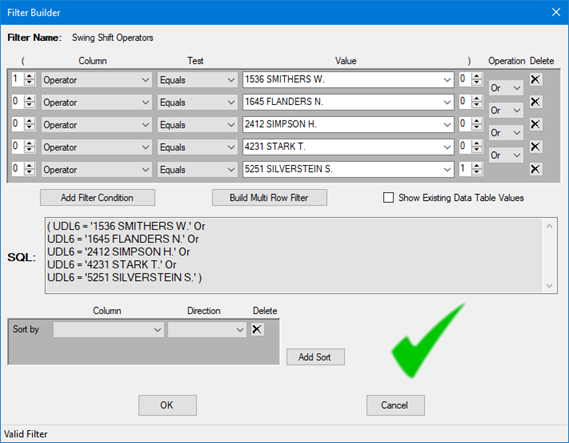
When creating a stored filter for traceability values, Events,
Causes, or Actions taken, you can now select multiple values at
once. This saves time and reduces errors.
For instructions, see Selecting
multiple values for Traceability, Event, Cause, or Action Taken.
Selecting a Dashboard, Inspection, or Python script and clicking the Used By button displays a list of other GainSeeker items (such as Desktops, Planned Inspections, or other Python scripts) that use the item you selected. Now a Copy to clipboard button is also provided so that you can copy and paste the list of GainSeeker items that will be affected if you edit or delete the selected item.
When managing SPC standards, DMS standards, and DMS processes, a new Find w/ No Data button will list items for which there are no data records. You can copy this list to Clipboard and delete items that are found not to have data.
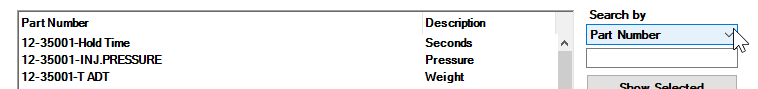
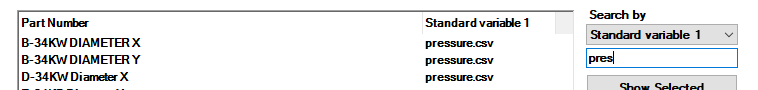
When selecting SPC standards or processes for charts, you can now search for the Part Number, Description, and Standard Variables.
The current GainSeeker user is now displayed in three more GainSeeker modules.
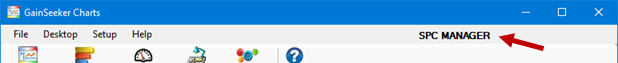
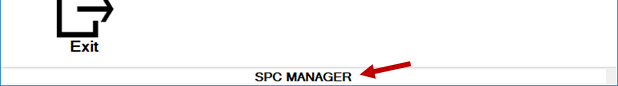
The GainSeeker Charts module now displays the name of the current GainSeeker user on the menu bar at the top of the main window.
The GainSeeker Inspections and PC Collect modules now display the name of the current GainSeeker user on the status bar at the bottom of the main window.
In previous versions, when setting the defaults
for new SPC standards, the system default for the Write
to monitor tables setting was For
real-time failures. This was convenient for writing real-time
failures to a secondary data table used by the legacy SPC Database
Monitor module, but it could slow down data storage and add to
the size of the database.
Beginning with GainSeeker version 8.9, the system default for this
setting is Never. The
new Monitor
Table chart is a convenient replacement for the legacy SPC
Database Monitor module, and it does not use this secondary data
table.
![]() Note:
If you use the legacy SPC Database Monitor module and need to
use For real-time failures
as the default setting for new SPC standards, you should use the
System Administration module to change the Write to monitor tables setting
for each configuration.
Note:
If you use the legacy SPC Database Monitor module and need to
use For real-time failures
as the default setting for new SPC standards, you should use the
System Administration module to change the Write to monitor tables setting
for each configuration.
A new SPC statistic, Trend crosses in, predicts when you might start to go out of spec. It returns the number of future subgroups at which the current trend line is expected to cross the closest specification limit. You can also create a custom statistic that converts this from a count of subgroups into predicted time to failure, based on your cycle time or frequency of data collection.
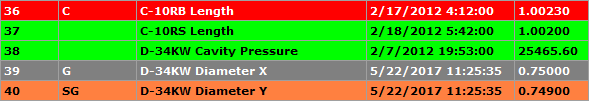
On tables and grids configured to display real-time failure colors, font colors are now automatically adjusted for legibility on rows or cells with darker real-time failure colors.
When configuring the settings for a DMS chart, the Standard overrides section now includes Goal Yield and Acceptable Yield.
When displaying Goal Yield and Acceptable Yield lines on various DPU charts, the numeric formatting of these chart limit labels has been improved.
The SPC Chart override
setting Skip statistics table
rows with no data from previous versions of GainSeeker
has been renamed as Skip
retrievals with no data on multiple charts and now
applies to most multiple-retrieval charts.
You can set
the default for this setting - and its equivalent DMS Chart override setting, Skip
statistics table rows with no data - in the System
Administration module.
A new TestSpecificTrace property for the Numeric Input test, Defect List test, Pass/Fail/NA test, Checkbox test, or Timer test lets you set traceability values for any single test. These traceability values are not displayed to the inspector during data entry, applied to other tests, or remembered across sub-inspections. Previously, you could only set test-specific traceability values using Python commands such as inspect.cursubi.ni(idx).settrace.
When configuring DMS charts and SPC charts for a sub-inspection, you can now specify a Chart skin that changes display options for these charts - including limits to display on the chart, data table columns, and much more.
A new ButtonMode property for a Defect List test makes it easy to configure one of two new defect entry modes:
SingleSelect - the inspector can only select one defect, and the defect count is limited to 1.
MultiSelect - the inspector can select multiple defects, but the count for each selected defect is limited to 1.
New properties for the Pass/Fail test - FailColor, NAColor, and PassColor - let you customize the color of the Pass, Fail, and N/A buttons for PC Collect data entry.
A new CancelButtonBehavior property for the sub-inspection makes it easy to configure the behavior of the Cancel button. In addition to the default behavior of displaying the list of sub-inspections, other options include displaying the list of inspections, displaying the list of planned inspections, or exiting the PC Collect module.
It is now easier to enter data for multiple Numeric Input tests where the inspector must choose related SPC standards (on one sub-inspection). The first time the inspector clicks the Select Part Number button, they need to search for the standard as before. However, when choosing the remaining SPC standards on this sub-inspection, GainSeeker highlights previously-chosen SPC standard - making it easy to scroll to other standards that are nearby in the list.
New email commands make it much easier to send email from a script and use the email settings already configured in the GainSeeker.
Previously-downloaded Library scripts (and code copied from them) that created an email variable will still work. If you find it confusing to edit these older scripts, consider renaming this variable name by replacing email = and email. with a different variable name.
Two new commands make it easy to generate a .pdf file from HTML or from an Excel file:
file.htmltopdf creates a .pdf file from an HTML file or from a string of raw HTML.
file.exceltopdf creates a .pdf file from an Excel file. It requires Microsoft Excel 2007 or later to be installed.
Several new inspect.sidepanel commands give you more control over the inspection side panel where charts, documents, images, and web pages are displayed:
inspect.sidepanel.itemtofront moves a tab to the left-most position and displays its contents.
inspect.sidepanel.frontonrefresh determines what happens to existing side panel tabs when submitting a sub-inspection will refresh a chart.
inspect.sidepanel.count returns the number of current side panel tabs.
inspect.sidepanel.labels returns a list of list of current side panel tab labels, in order.
inspect.sidepanel.addfile replaces inspect.cursubi.addfile.
inspect.sidepanel.addwebpage replaces inspect.cursubi.addwebpage.
inspect.sidepanel.clear replaces inspect.cursubi.clearsidepanel.
inspect.sidepanel.selectitem replaces inspect.cursubi.selectsidepanelitem.
The new file.xls.clearworksheet() command clears the current worksheet in an Excel file.
The inspect.cursubi.passfail(idx).value command has been updated so that you can set the Pass/Fail/NA test to -1 (not set). In previous versions, you could read this status but not set it.
The retrdms commands have been updated to simplify data retrieval for one part number across multiple processes.
New commands statspc.data.note() and statdms.data.note() return a list of Note values for the retrieved data.
New commands sql.tables.defectlist, sql.tables.hsiscripts, sql.tables.inspectionuniqueid, and sql.tables.tracepriority return additional table names for the current configuration.
New commands stddms.goal, stddms.acceptable, and stddms.yieldmode let you work with Goal Yield and Acceptable Yield limits for DMS standards.
The new login.configname command returns the name of the GainSeeker configuration used by the currently logged in GainSeeker user.
The new inspect.subinspectionlist command returns the list of sub-inspection names in the order in which they appear (top to bottom) for the current inspection.
New commands inspect.cursubi.timer(idx).settrace and inspect.cursubi.timer(idx).gettrace set and get test-specific traceability values for a Timer test.
The Python Script Editor now includes a  (Compare) button that
makes it easy to compare
two similar scripts and identify the differences between them.
(Compare) button that
makes it easy to compare
two similar scripts and identify the differences between them.
In the GainSeeker Inspections module, when using the Python
Script Editor, the  (Used By) button now searches
not only for inspections that run the selected script, but also
any other scripts that may run the selected script via the misc.executescript command and dashboards
that may run the selected script in a DateTime
control (OverdueAction
property) or in a Button
control (ClickAction
property).
(Used By) button now searches
not only for inspections that run the selected script, but also
any other scripts that may run the selected script via the misc.executescript command and dashboards
that may run the selected script in a DateTime
control (OverdueAction
property) or in a Button
control (ClickAction
property).
Documentation for all Python commands now indicates the GainSeeker version(s) in which that command was added or changed, beginning with GainSeeker version 8.7.
Documentation for using Python in GainSeeker has been updated to note that you can use the GainSeeker Inspections module to create Python scripts as block of re-usable code, which can be executed from most other Python scripts - including scripts for external data and dashboard controls - using the misc.executescript command.
Documentation for the error.stoponerror command has been updated to note that its default value is True (halt when an error occurs).
Documentation for the inspect commands has been updated to include a technique for deleting the current Unique ID.
Documentation for dataspc.rtf.autocalcrtfs has been updated to clarify which real-time checks will be performed if this property is set to True.
Documentation for dataspc.rtf.autocalcrtfs and dataspc.rtf.value has been updated to better explain the relationship between these two commands.
When designing a Dashboard with the SnapToGrid property enabled, the gridlines are now displayed. This functionality automatically adjusts the size and location of dashboard controls so that their edges line up with this design grid.
When creating a Paired Sample chart, the Traceability group by option formerly labeled as 'None' has been renamed to 'Count'. This more accurately reflects how data is still grouped before matching the data pairs, even when a traceability field is not used for that grouping.
A Dashboard that is larger than the screen resolution on the current display will now automatically display scroll bars so that users can scroll to view the parts of the dashboard window that do not fit on their display.
When sending a table or list to .rtf or .html file, GainSeeker now includes all colors that are displayed on the table or list.
When designing a Dashboard with a Button control, you can
now configure the ClickAction
property to automatically refresh the dashboard after the
selected Action is complete.
An equivalent option has been added to a DateTime dashboard control
in the OverdueAction
property.
Charting External Data now supports multiple standards and processes. In the past, an external data set could only be analyzed as information for one standard.
New user-defined labels for Part
label (plural) and Process
label (plural) can be modified in each configuration.
When upgrading from a previous GainSeeker version where these settings
were not available, GainSeeker will automatically set these new
labels by using algorithms to pluralize your existing Part
label and Process label
settings - but you can edit these new labels as desired.
In previous versions, the system-wide setting Query timeout was required to be 30 seconds or longer. You can now set this to any value.
The Chart Limit Label settings for OEE/DPU/Yield Acceptable and OEE/DPU/Yield Goal have been moved to (configuration name) | User-defined labels | DMS | Chart limit labels.
Two new Role permissions give you more granular control over what users can do in the GainSeeker Charts module:
In previous versions, a user with the right to Delete Desktop could also delete dashboards. There is now a separate Delete Dashboard permission that determines the right to delete dashboards.
In previous versions, a user with the right to Delete Report Format could
also delete SPC data
and DMS data dashboard
retrievals.
Additionally, a user with the right to Delete
Python Script could also delete SPC
data (scripted) and DMS
data (scripted) dashboard retrievals.
There is now a separate Delete
Dashboard Retrieval permission that determines the
right to delete dashboard retrievals.
When using the Standard Utility to duplicate SPC standards, you can now set the Description for those new standards.
The font size has been increased on the Open Template, Open Planned Session, and Open Stored Session windows. This makes it easier to view and select the correct item for data entry.
Please note that the System
Requirements for installing GainSeeker now require Microsoft
.NET Framework version 4.5, which cannot be installed on Windows
XP.
Windows XP workstations can continue to run older GainSeeker versions
(8.0-8.8.1) even when GainSeeker 8.9 is installed on other workstations.
Instructions have been added for Using Gate limits for Historical Control limits.
Instructions for importing a data file that you exported from GainSeeker and then edited in another program have been added.
Information on Retrievals for dashboard controls has been updated to note that Python scripts used for dashboard retrievals cannot use the Python Display commands.
Information on Cms.ini has been updated to note that when using GainSeeker Mobile Web Service, the mobile web server will use Cms.ini files from two locations.
Information on changing the chart setting for Show time to has been updated to note that it will not be applied to SPC or DMS data tables. To display a different time precision on these data tables, you must change the default Show time to setting for the configuration.
Information on changing the Standard overrides chart settings for SPC Part Number and DMS Part Number and Process has been updated to note that these Standard overrides are not applied to Data Tables.
Information on choosing statistics for Dynamic Reports has been updated to note that custom GainSeeker statistics are not available in this module, and to recommend other methods for performing mathematical functions in your Dynamic Reports.
Information on Sending information to MINITAB via COM has been updated to note that SPC charts from the One window for all (multiple retrievals) list require the Row column will be sent to MINITAB check box to be selected in the chart Settings.
A Known Issue has been documented for errors launching GainSeeker modules on Citrix when the user has dual monitors set to high resolution.