Choosing a Chart or Report

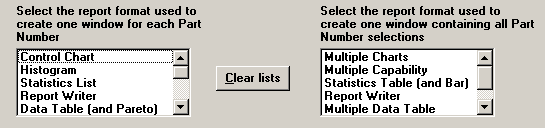
When you use the Chart Wizard, Quick Chart, or Chart Designer (excepting the Columnar Report) to generate charts and reports, you must choose from two lists of chart and report options.  

The following topics show you how these charts look and how they work:

One window for
each retrieval group


One window containing all
retrieval groups

Control Chart


Multiple Charts

Histogram


Multiple Capability / Box & Whisker

Statistics List


Statistics Table (and Bar)

Report Writer (single)


Report Writer (multiple)

Data Table and Pareto


Multiple Data Table

Combination Chart


Group Chart

Scatter Chart


Combined Control Chart

Trend Chart


EWMA Chart


Moving Average Chart


Control and Bar Chart


Time Axis Chart


CuSum/Control Chart


MINITAB Charts


More:

Understanding retrieval groups