![]() Use the Dashboard Grid dashboard control
to display statistics, real-time failures, and other key SPC and DMS data
for a range of part numbers—all
within the same grid .
Use the Dashboard Grid dashboard control
to display statistics, real-time failures, and other key SPC and DMS data
for a range of part numbers—all
within the same grid .
This control can automatically refresh at a time interval you define or it can refresh along with the dashboard window.
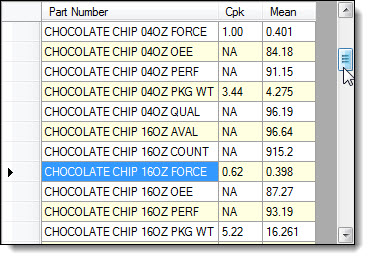
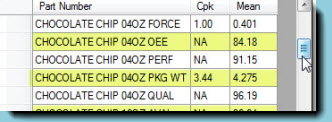
This is an example of how a Dashboard Grid control might look on a running dashboard, depending on the properties you assign to it:
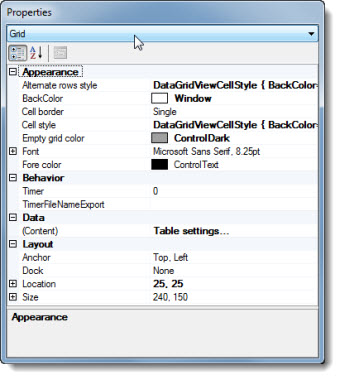
Some of the Dashboard Grid control properties (attributes) may be familiar in usage and not require additional explanation. The properties that may have been specifically designed for GainSeeker users are featured in this topic.
See the Properties dialog for usage information
The Define Grid Rows and Columns dialog opens. See Using the Define Grid Rows and Columns dialog
The control opens on the host dashboard in design/edit mode, displaying stock data in the selected column and row labels. (User-selected data will display after the dashboard window is saved in design/edit mode and redrawn when opened in run mode.) The Properties dialog menu displays the Grid setting and the properties grid displays the properties specific to this control for which the property values can be changed.
You can use the right-click Send Control To menu option to send text—representing data for a Dashboard Grid control—to Microsoft® Excel or a PowerPoint presentation. This option does not send sparkline cell charts to Excel or PowerPoint—only data values. If you want to send sparklines too, send the Data Grid to Word or other text editor such as Notepad.
Clipboard
Application
Save As File
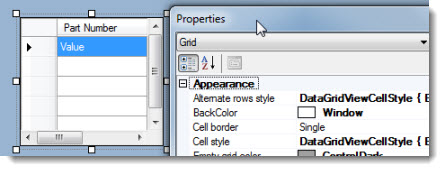
Click the Dashboard Grid control on the dashboard window that is open in design/edit mode to select the control for edit.
The Properties dialog menu changes to display the Dashboard Grid setting and the properties grid displays the properties specific to this control.
Set the property values for odd-numbered row cells to help visually distinguish them in the grid. This Dashboard Grid example has a color assigned to it for alternate row cells in the grid.
Click the Alternate rows style
property value cell under Appearance.
Then, click the ellipsis button ![]() in
the cell.
in
the cell.
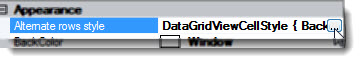
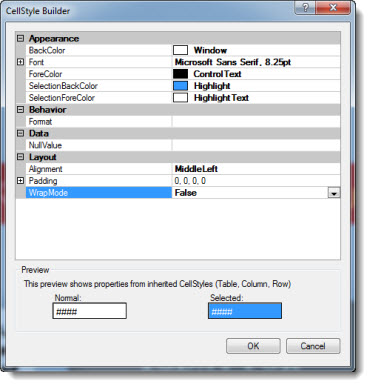
The CellStyle Builder dialog box opens. See the CellStyle Builder dialog for more information.
Set property values for the grid cells using the Cell style property in the Properties dialog
![]()
The CellStyle Builder dialog opens.
See the CellStyle Builder dialog for more information.
Change style properties for grid cells and alternate rows for the control using the CellStyle Builder dialog.
The CellStyle Builder dialog is similar in usage to the Properties dialog. See Using the Properties dialog for more information on editing property values.
To edit the table settings that determine the data retrieval for the grid:
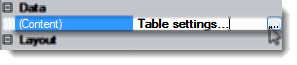
The Define Grid Rows and Columns dialog opens. See Using the Define Grid Rows and Columns dialog
If you want to change the font for all the retrieval information in the grid, you will need to set the Font property and the Alternate rows style property to the same Font setting options.
Please note that your font color settings may be overridden in cells where real-time failure colors on the table would make that text illegible.