Choosing an SPC Chart type
You can set default chart types and chart settings for a configuration
in the GainSeeker System Administration
module. See Chart
Defaults settings
Selecting charts from the lists
To: |
Do
this on the Charts tab lists: |
Clear all selections on both lists— |
Click the Clear button. |
Select one chart type from a list— |
Click the chart
name. |
Select several chart types listed
in sequence in a list— |
Click the first standard you want to select. Press and hold the SHIFT key. Click the last chart type you want and click
on it.
All chart types between the first and
last chart types will be selected.
or
Click the first or last standard you want
to select. Press and hold the SHIFT key. Press the arrow keys on the keyboard to scroll
up or down the list. |
Select several chart types not
listed in succession in a list— |
Click a chart
type and press and hold the CTRL key while clicking additional
chart types. |
SPC Chart types
These topics provide examples of each chart
and how each functions:
 See
Skip
single charts with no data to set GainSeeker so that charts will be
drawn only for retrievals that have data. For example, if you select charts
for five standards and only three standards have data, only three charts
will be drawn. This setting only applies to charts listed in the One window for each (the left) table
column above.
See
Skip retrievals with no data on multiple
charts to set GainSeeker so that only the retrievals that have data
will be included on multiple-retrieval charts. For example, if you select
Process Capability for five standards
and only three standards have data, only three charts will be included
in the Process Capability window. This setting only applies to charts
listed in the One window for all (multiple
retrievals) (the right) table column above, excluding the Monitor
Table and the Multiple-standard Data Table.
See
Select all the
standards in the list to see how charts work differently when all
SPC standards or processes are selected.
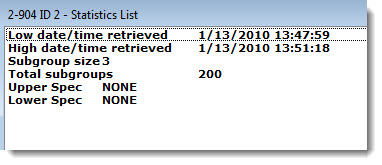
Statistics Lists
A Statistics List displays user-selected
statistic labels in the left column and the corresponding statistic in
the right column using a listing format.
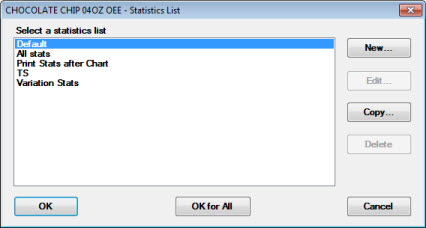
The OK for All button on the
Select a statistics list dialog
can be used to apply the selected statistics list to all of the part numbers
you select for the retrieval.
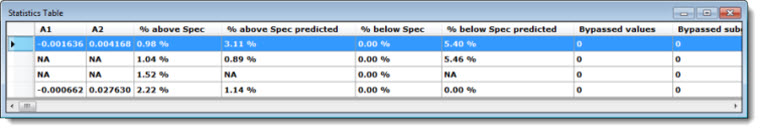
Statistics Tables
A Statistics Table uses a table
format to display statistics that are user-selected as being relevant
to the data.
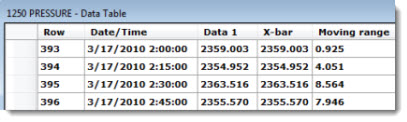
Data Tables
A Data Table is a comprehensive,
compact display of user-selected data and traceability values in a table
format that can easily be converted into a chart.