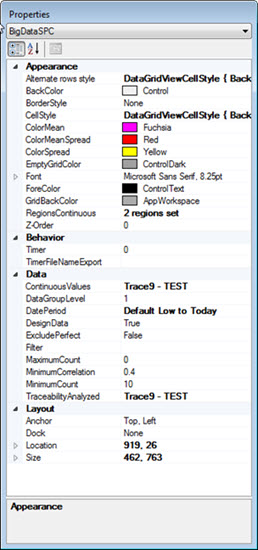

About the Big Data Analytics SPC dashboard control
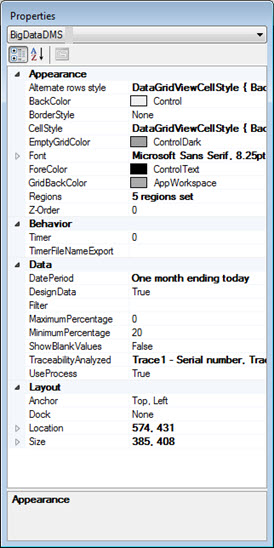
About the Big Data Analytics DMS dashboard control
|
Contents [Hide] |
Big Data analytic dashboard controls can display a vast amount of data in a retrieval compared to some of the other dashboard controls. Large amounts of data can make a retrieval slow. If you are experiencing this, consider using a longer refresh rate for the Timer property.
Also see Refreshing dashboard windows
See using the Properties dialog for instructions on using Properties grids.
Some of the properties for these controls may be familiar in usage and may not require additional explanation here. The properties specifically designed for GainSeeker users are featured in this topic.


If you want to change the font for all the retrieval information in the grid, you will need to set the Font property and the Alternate rows style property to the same Font setting options.
The Big Data Analytics SPC control can analyze both Discrete and Continuous data values. There are a few property setting conditions about which you should be aware when you analyze either or both of these data types on this dashboard control.
Analyzing continuous data on this dashboard control is dependent on the settings for two properties:
the TraceabilityAnalyzed property
and the ContinuousValues property
To set these properties:
Select one or more items with continuous data values to analyze from the Select Traceability dialog that opens from the ContinuousValues property.
--and--
Then, you must also select those same items from the Select Traceability dialog that opens from the TraceabilityAnalyzed property. (You can additionally select traceability items for retrieving discrete data on the same dialog.)
Choose traceability items with discrete data to retrieve using the TraceabilityAnalyzed property.
These properties only apply to discrete data retrievals. For information on setting color ranges for continuous data, see the RegionsContinuous property below.
ColorMean: Color for items that exhibit a significant difference for the t-Test
ColorMeanSpread: Color for items that exhibit a significant difference for both the t-Test and F-Test
ColorSpread: Color for items that exhibit a significant difference for both the F-Test
ExcludePerfect: True/False field. When set to True, excludes continuous correlations 1 from the results (typically due to the data value being stored as a Traceability).
Set the Maximum number of data points to retrieve for each part number.
The minimum correlation value required for items to be shown in the results. Any results less than the set correlation are ignored. Correlation values of zero are always ignored. Correlation values are always calculated as positive values using the absolute value of the result.
Set the minimum number of data points to retrieve for each part number. If the set minimum number is not met, data for that part number is ignored.
Enter a value to rank the traceabilities you selected using the TraceabilityAnalyzed setting. Level 1 ranks the traceability by impact when data is grouped by the Grouped by column value. Level 2 ranks traceability by interactions when data is filtered by the Data Filtered by column value and grouped by the Grouped by column value. This setting does not alter the continuous data correlation calculation.
If you choose to analyze continuous traceability items, select one or more items on the Select Traceability dialog that opens. The traceability you select must also be selected in the TraceabilityAnalyzed property.
The selected traceabilities are analyzed as continuous data.
The RegionsContinuous property allows you to set color regions to indicate how strongly correlated the traceability value is to the data value.
The Regions property allows you to set color regions to indicate the percent of defects for each row in the grid.
MaximumPercentage: Exclude values from the retrieval that are greater or equal to this percentage. Set to 0 to disable this feature. Set to 100 to have GainSeeker ignore categories that only have one value.
MinimumPercentage: Exclude values in the retrieval that are less than this percentage.
True: Items without defects are displayed.
False: Items without defects are not displayed.
False retrieves data by DMS standard.
True retrieves data by Process.
Set the date period so a column only retrieves data points that fall within the date period you specify. Narrowing the date range can significantly shorten retrieval time.
When a dashboard is open in design/edit mode, any dashboard controls it hosts display Design data (fictitious data) instead of actual data. This default setting can help conserve the time it may take to retrieve and calculate lengthy data for some dashboard controls.
Assign a filter to a column retrieval.
The traceability items to be used in the analysis. Use this property to select discrete and continuous traceability items for SPC retrievals and discrete traceability items for DMS retrievals. You must choose at least one traceability item. Changing this property does not cause the data to refresh.
Set the coordinates of the upper-left corner of the control relative to the upper-left corner of the dashboard window.
The dashboard control size in pixels.