Most of the information in this topic is specific to the GainSeeker Charts module.
Descriptions of the more than dozen other dashboard controls follow in this topic. The dashboard control images featured below are examples of many possible options you can design into a dashboard control, including appearance and retrieval properties.
|
Contents [Hide] |
Dashboard control types and descriptions follow.
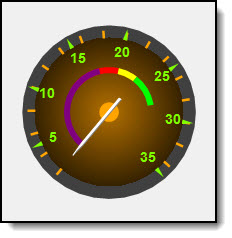
Displays key process indicators along with multiple statistics and user-selected text on a gage. Optionally use color recognition to define acceptable, unacceptable, and cautionary data zones on the gage. Choose from six ready-to-display skins for each gage type or customize your own. Dial Gage and Bar Gage examples follow:
_____________________________________________
Runs a file or template, or loads a dashboard or desktop any time the Button dashboard control is clicked. The background color of the Button can optionally serve as an alert for an out-of-range statistic as in this example in which red was assigned as an alert.
For more information, see Button
![]()
_____________________________________________
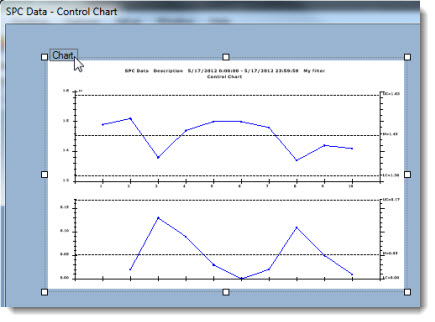
Serves as a quick reference for data retrievals on the dashboard window—but unlike the charting window in the GainSeeker Charts module—it features limited drill-down capabilities.
For more information, see Chart dashboard control
_____________________________________________
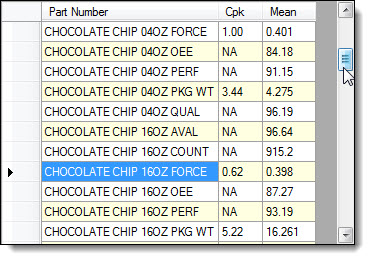
Displays statistics, real-time failures, sparklines, and other key SPC and DMS data for a range of part numbers—all within the same grid.
_____________________________________________
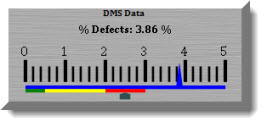
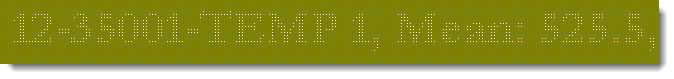
Stands out from the other controls on the dashboard window with eye-catching special effects, including scrolling text and data, sparkling or fading text, and color to spotlight key information. Choose from six ready-to-display skins from which you can customize your own.
_____________________________________________
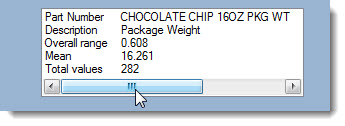
Allows for targeted, statistical data analysis of a standard or process you select, then displays data on a dashboard in a text format you define.
![]()
_____________________________________________
Displays static text you choose on a dashboard window for posting reminders, labeling, and more.
![]()
_____________________________________________
Displays user-selected statistics as a quick-reference tool.
_____________________________________________
Choose between displaying the current date and time, the date and time of the most recent dashboard refresh; the date and time of the latest data collection (checks for new data based on clock time); or the date and time of the latest data collection (checks for new data based on elapsed time since the last check).
![]()
_____________________________________________
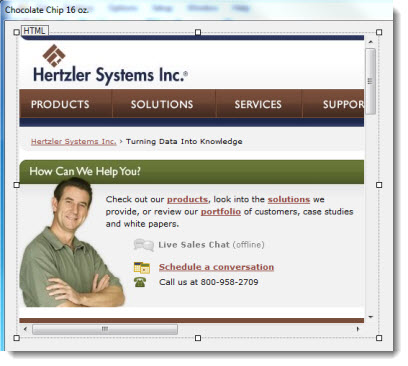
Displays an HTML file or a URL (webpage) using the control's web browser.
_____________________________________________
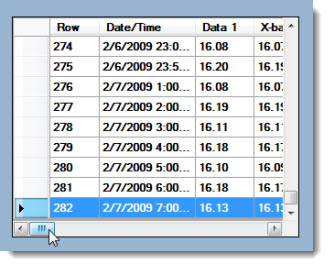
Display detailed data and traceability values that you select, which can easily be converted into a GainSeeker chart or full-size data table for deeper analysis.
_____________________________________________
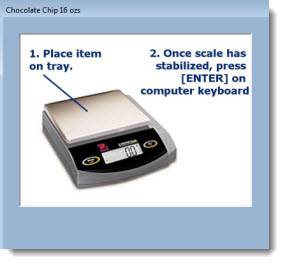
Displays an embedded or external source-file image for reference, which you select.
_____________________________________________
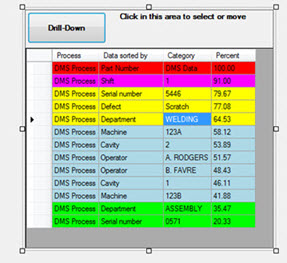
Displays vast amounts of data that can be filtered to help you determine at a glance which data to drill down into on a Pareto chart. Color assignment helps you quickly identify results.
_____________________________________________
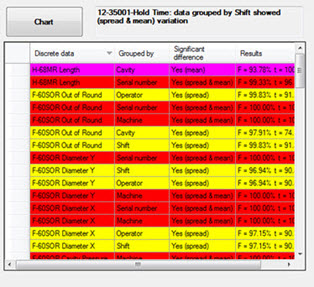
Display vast amounts of data at a time to help you pinpoint where to focus your improvement efforts. Assign colors to results that fall within limits you specify to help you quickly identify data range groups.
_____________________________________________
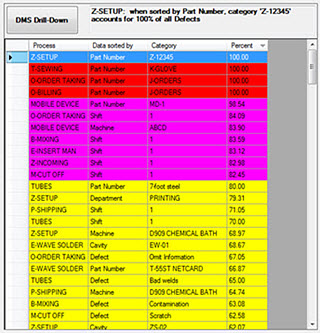
Display vast amounts of data at a time to help you pinpoint root causes of defects. Assign colors to results that fall within limits you specify to help you quickly identify data range groups.
_____________________________________________
The Python Script Designer dashboard control lets you design a Python™ script that can give you greater functionality in GainSeeker.
This is one of multiple ways this dashboard control might display, depending on how it is designed.
To get started designing the dashboard window using controls, see Adding dashboard controls to a dashboard window
Dashboard Controls can automatically refresh at a user-defined time interval or refresh along with the dashboard window to which you have assigned them.