
Collecting and analyzing your Likert scale data has never been easier!

The new Rating test makes it easy to:
collect data on a scale, starting with a number as low as 0 and ending with a number as high as 9.
optionally include an "N/A" ("Not Applicable") button for occasions when the Rating test does not apply.
store the scale data as DMS data, SPC data, or both (OR not store this data at all).
assign defects to individual buttons.
assign colors to individual buttons.
New Python commands for the Rating test are also available.
A new System-wide setting - Email send method used - allows the GainSeeker Charts, PC Collect, GS Console, and Dynamic Reports modules to send email via Microsoft Outlook. This setting also applies to Python scripts that send email.
Many new date options have been added to current modules such as GainSeeker Charts, PC Collect, GS Console, Dynamic Reports, and System Administration. They include:
The ability to change the First day of the week from Sunday to Monday.
This new configuration setting affects Date Periods such as Current week or Previous week as well as data grouping by week for DPU, OEE, and SPC data.

Expansion of the configuration setting for Last 'n' hours ending now from a maximum of 23 hours to 1000 hours.
Unlike the other new date options listed above, this one also applies to legacy modules such as SPC Data Entry, SPC Charts and Reports, DMS Charts and Reports, and Enterprise Dashboard.
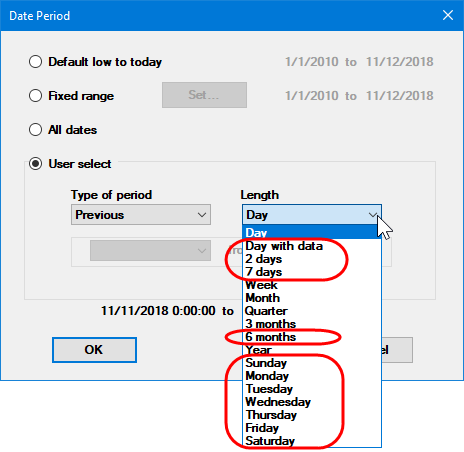
11 new Date Periods:
Date Period |
Notes |
Previous Day (with data) |
This date period searches for the last day where data was found, within the last 10 days, and analyzes the data for just that day. This makes it much easier to analyze Friday's or Saturday's data on Monday morning - or configure dashboards and desktops to do this. |
Previous Sunday |
This makes it much easier to analyze Friday's data on Monday morning - or configure dashboards and desktops to do this. This also makes it possible to configure a Dashboard Grid with one column for each day of the week. |
Previous 2 days |
This makes it much easier to analyze the weekend's data on Monday morning - or configure dashboards and desktops to do this. |
Previous 7 days |
Unlike Week ending today, this date period analyzes data from the previous seven days (not including today). |
6 months ending today |
|
Would you like to make a Dashboard Grid that automatically updates itself to reflect the latest Shift, Part Number, or Lot Number? Now you can!
A new column property, Limit to most recent, lets you choose a data field - traceability, part number or process (DMS) - that will be used to additionally filter the column, based on the most recent value in that field.
The new Python command inspect.messagearea.script converts the Message Area into a button that runs a Python script when clicked.

When using the individual Note for a Test, the inspector can now enter Event, Cause, Action Taken, and/or Anchor Point data for that test - without affecting any other tests on the sub-inspection.
|
Individual Note button for the Defect List test |
|
|
|
Individual Note for a DMS test like Defect List |
|
|
|
|
Individual Note for an SPC test like Numeric Input |
New Python inspection commands can also be used to set these values for a test.
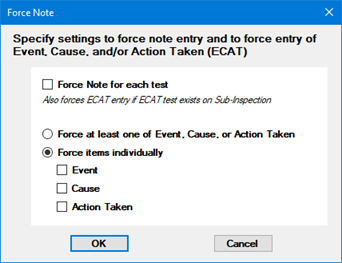
With the new Note windows shown above, you now have new options that require the inspector to enter an Event, Cause, and/or Action Taken when a defect or real-time failure is present.
You can set this requirement for the sub-inspection:
and for a Defect List, Numeric Input, Pass/Fail, or Rating test:
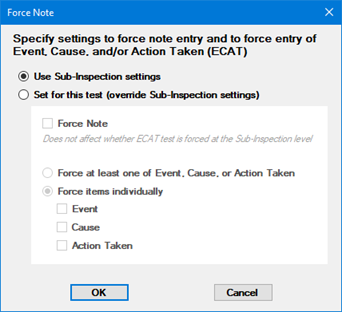
New Python inspection commands can also be used to set these values for the sub-inspection and for a test.
You can now install GainSeeker on a SQL Server for Linux database using SQL Server authentication.
For more information, see Setting up GainSeeker on a SQL Server database.
For analysis of large data sets and complex dashboards, a 64-bit version of the GainSeeker Charts module is now available.
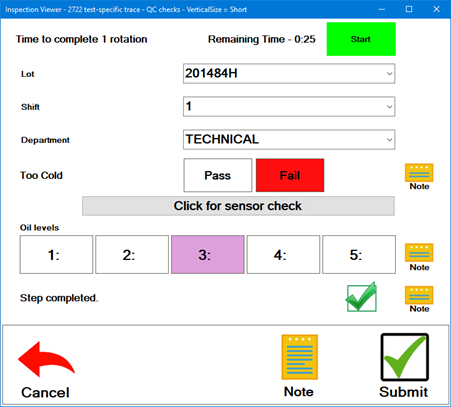
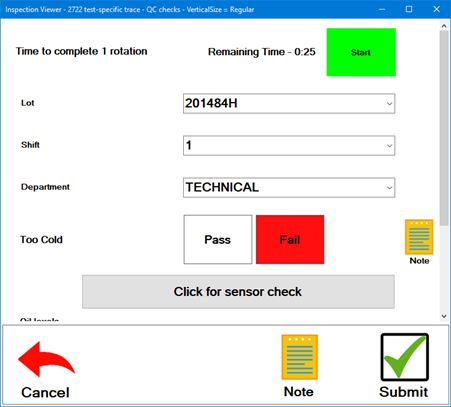
A new VerticalSize
property for most Inspection tests helps you to fit more tests
on the screen without scrolling. For tests where this property
is set to Short, the test
may be shorter, and white space above and below this test may
be reduced.
New Python
commands for this property are also available.
The following examples display the difference between tests with
VerticalSize set to Short (the first sub-inspection)
and those with VerticalSize
set to Regular (the second
sub-inspection):
A new SearchMode property for Traceability and DMS Standard tests lets inspectors type multiple characters to search the list of pre-defined traceability values or DMS standards.
A new inspection property NI_DisableSubmitOnFailure can be used to disable the Submit button when a Numeric Input test has a real-time failure. This makes Numeric Input test failures work the same as all other tests with failures.
When creating a new Inspection, GainSeeker now prefills the Inspection properties TraceabilitySubInspection and TraceabilityTest to match the last inspection you edited on this workstation. You will no longer be prompted to select these two traceability fields each time you create a new inspection on the same workstation.
You can now double-click any test to edit a specific property. For example, double-clicking a DMS Standard test will automatically edit the DMSStandard property and display the list of DMS standards.
For the Pass/Fail/NA test, the ShowNotApplicable property has been renamed to ShowNA.
The new Inspection property EnterKeyBehavior lets you configure how the Enter key works during inspection data entry.
GainSeeker has improved the user's
ability to press the Tab key to move between the following tests:
Date/Time, Traceability, Numeric Input, Pass/Fail/NA, Checkbox,
Defect List, DMS Standard, Formula (when FormulaMode
= Click), and the new
Rating. The user can also press Shift+Tab to move backward through
these tests.
Also, when one of these tests has the focus (e.g., after tabbing
to that test), the user can press the Spacebar to select an option
or to switch a feature on and off:
On the Checkbox test, pressing the Spacebar will check or un-check the check box. (When the Response property is set to Initials, the user cannot type a space in the box for initials.)
On the Timer test, pressing the Spacebar is equivalent to clicking the timer button (Start or Stop).
On the Pass/Fail/NA test, pressing the Spacebar is equivalent to clicking the next button (left to right - Pass, Fail, N/A).
On the Rating test, pressing the Spacebar is equivalent to clicking the next button (left to right).
On a Defect List test with the ButtonMode property set to SingleSelect or MultiSelect, pressing the Tab key moves to the next defect button (left to right) and then pressing the Spacebar is equivalent to clicking the current defect button to set or clear that defect.
When the Inspector uses the Search box to filter for the Inspection name, that search is now remembered until the PC Collect module is closed.
When editing a Python script, new keyboard shortcuts make it easy to move or delete lines of code.
When debugging a Python script, you can now press F9 to add a breakpoint to the current line of code.
When debugging a Python script, stopping the debugger will now close the Inspection window and leave the Python Script Editor window open at its current position.
A new inspect.setprocess command lets you change the Inspection process.
The mtconnect.dataitemid and mtconnect.current() commands have been updated to support a list of Data Item IDs and a list of values. The mtconnect.sample command is now deprecated and the mtconnect.current() command should be used instead.
A new group of commands allows you to change (or get) whether a particular test is visible. For example, the command for a checkbox test is inspect.cursubi.checkbox().visible. (This functionality already existed for the Numeric Input test as inspect.cursubi.ni().visible).
A new email.display() command displays a window for a new email message. The end user can interact with the email window to change recipients, subject, body text, etc. The email will not be sent until the user clicks to Send it.
The retrdms.setretropt and retrspc.setretropt commands have been updated to let you set data grouping options for the retrieval. This is useful for Python dashboard retrievals where you cannot change individual chart settings on the fly.
Scripts for Custom Statistics can now use the email commands.
Scripts for Device Profiles can now use the new serial.persist command to pass values between the Device Profile script and the Inspection script.
Scripts for Device Profiles can now use the new serial.dispmessage command to display a popup window with a message and one button. This makes it possible to trigger a reading from only specific cells in the subgroup.
You can now use a simpler method of configuring the Python Script Comparison tool by using the PC Collect Setup menu to change the Settings.
GainSeeker can now calculate the overall OEE statistic even when one or two of the three underlying statistics - Availability, Performance, and Quality - cannot be calculated. This new capability is enabled by default but can be disabled by a new configuration setting in the System Administration module.
When configuring a Dynamic Desktop to retrieve data with a Python script, you can now use the new Add/Edit External Data Scripts button on the Create Dynamic Desktop window to add, edit and debug the Python script.
When you right-click on any Dashboard control and generate a Chart for the data behind that control, you can now edit or delete data from that Chart. The Dashboard will reflect changes in the data the next time it is opened or refreshed.
When a Dashboard Grid is opened or refreshed, GainSeeker now displays a progress indicator until all of the grid contents are ready to display.

When a Pareto chart is displayed, the percentage of total is displayed at the end of each bar - even when there is only one bar on the chart. (In previous versions, this percentage was suppressed when there was only one bar.)
Documentation for changing a Role now describes every permission listed in a role.
Documentation for selecting SPC standards for charts and selecting DMS standards or processes for charts has been updated to explain how some charting options work differently when all standards or all processes are selected for analysis.
The topic for the Python command: Data SPC has been updated to clarify that the Python commands dataspc.eventspc, dataspc.cause, and dataspc.actiontaken must specify the Long Description for the Event, Cause, or Action Taken.
The topic for the Python command: Inspection has been updated to include the inspect.cursubi.datetime(idx).datetime command.
The topic for the Python command: File has been updated to include the file.xls.setsheetbyname and file.xls.sheetname commands.
Documentation for the disp.newbrowser() Python command now includes troubleshooting information for JavaScript and reading HTML values.
Documentation for the retrdms.filter and retrspc.filter Python commands has been updated with additional details when filtering on traceability fields 7 and higher.
Documentation for the inspect.sidepanel.clear() Python command has been updated with additional details.
Documentation for Python Special Variables now includes examples for how to correctly changes those variables from a function or class.
The topic for the Cms.ini setting de_method= has been updated with additional details.
The topic for the Dashboard Grid control has been updated to better describe special options for the Cell display property such as DataCount and Real-time failure count.
The help topics for OEE have been updated for clarity. The main topics for OEE are Introduction to OEE, Requirements for collecting OEE data, and OEE Calculations.
The topic for Known Issues has been updated with workarounds for an "Out of Memory" error when displaying and refreshing a dashboard that contains a Chart control.
The topic for Creating Pareto charts from SPC Data Tables was updated to note that the SPC data table must display all of the traceability and corrective action columns for which you may want to create meaningful Pareto charts.
The topics for using the Edit/Open button to open a Dashboard with changes - Opening a Dashboard with Changes, Open a Dashboard using different Part Numbers or Processes, Open a Dashboard using different Date Ranges, and Open a Dashboard using different Filters - have been updated to clarify that:
permanent changes can only be saved by editing the dashboard.
temporary changes cannot be applied to SPC data (scripted) or DMS data (scripted) dashboard retrievals.
The topics for using the Edit/Open button to open a Desktop with changes - Opening a Desktop with Changes, Open a Desktop using a different Part Number or Process, Open a Desktop using a different Date Range, and Open a Desktop using a different Filter - have been updated to clarify that:
saving a changed desktop will not save changes to dashboards in the desktop; the only way to change a dashboard is to edit the dashboard.
temporary changes cannot be applied to SPC data (scripted) or DMS data (scripted) dashboard retrievals.